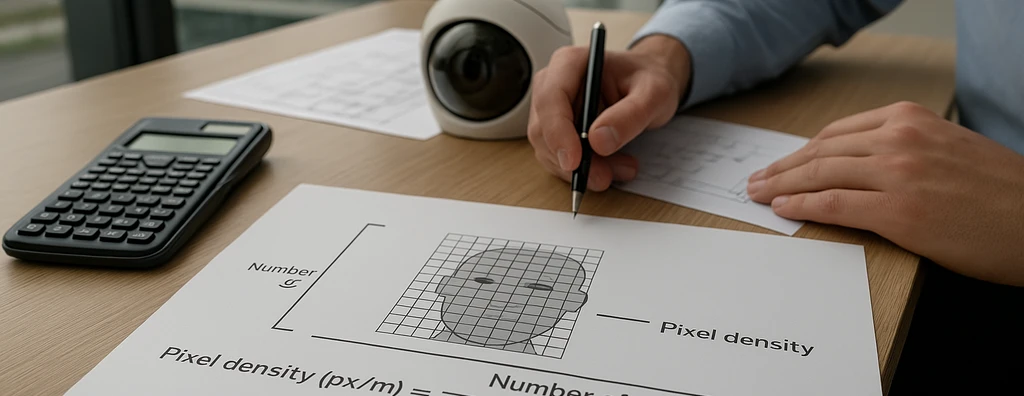
Learn how to calculate pixel density in video surveillance in px/m, relate resolution, scene width, lens, and distance, and correctly apply the new IEC 62676-4:2025 criteria without confusing legacy DORI with the current classification.
Check it out!
The pixel density in video surveillance indicates how many image pixels represent one unit of scene width at the target plane, normally expressed in pixels per meter (px/m). The basic calculation is straightforward: divide the horizontal resolution actually used by the horizontal scene width, in meters, in the region where the requirement must be met. Thus, an image with 1920 horizontal pixels distributed across an 8 m width produces, on average, 240 px/m at that plane.
The number, however, should not be treated as a fixed property of the camera. Density changes with distance, focal length, field of view, stream resolution, cropping, dewarping, and scene geometry. Even when the calculated value is sufficient, lighting, movement, shutter speed, compression, noise, focus, and target angle can reduce the detail that is actually usable. Therefore, px/m is a design and verification criterion, not a substitute for image testing.
The standards reference also needs to be updated. The IEC 62676-4:2025, second edition, replaced the 2014 edition and redefined the pixel-density system. The classic levels associated with DORI remain relevant for understanding legacy designs, datasheets, and installations, but they should not be presented as if they were the current classification in the 2025 international edition. This article separates these two layers and shows how to calculate, specify, and validate pixel density without turning the standard into a decontextualized table.
What Is Pixel Density in Video Surveillance?
Pixel density is the relationship between the number of pixels available in the image and the physical dimension of the scene those pixels represent in a region of interest. In video surveillance, the most practical unit is px/m.
The concept can be written as:
pixel density (px/m) = useful horizontal pixels ÷ scene width at the target plane (m)
If a stream has 3840 horizontal pixels and the observed region is 12 m wide at the analyzed plane:
3840 ÷ 12 = 320 px/m
This means that, under that geometric condition, each meter of scene width is represented by about 320 horizontal pixels.
The term useful pixels is important. The calculation should consider the image resolution actually used for the operational task — viewing, recording, export, or analysis — and not necessarily the sensor’s nominal megapixel count. If a high-resolution camera records a reduced secondary stream, the resolution of that stream limits the detail available in the recording.
The specification of video-surveillance monitoring points addresses the complete functional unit of the design. Pixel density is one of the parameters of that specification, alongside operational objective, region of interest, lighting, geometry, movement, and test criterion.
Why Megapixels Alone Do Not Determine Whether a Camera Meets the Requirement
Saying that a camera has 2 MP, 4 MP, 8 MP, or 12 MP does not indicate how much detail will reach the target. Total sensor resolution is only one variable in the relationship.
A camera with many pixels can deliver low density when it uses a very wide field of view. Likewise, a lower-resolution camera can provide high density when observing a narrow passage, a doorway, or another target framed in a controlled manner.
Consider two situations with 1920 horizontal pixels:
| Scene width | Horizontal resolution | Average density |
| 4 m | 1920 px | 480 px/m |
| 8 m | 1920 px | 240 px/m |
| 16 m | 1920 px | 120 px/m |
| 32 m | 1920 px | 60 px/m |
The camera is the same. What changes is how much of the scene each pixel needs to represent.
This shows why specifications such as “minimum 4 MP camera” are incomplete when the objective is image performance. The requirement should begin with the information that needs to be obtained from the scene and only then be converted into resolution, lens, distance, position, and other characteristics.
From Camera Resolution to Pixel Density at the Target
The design chain can be summarized as follows:
The designer should avoid reversing this logic. Choosing a camera first and then trying to justify the result with a px/m calculation turns a performance requirement into catalog validation.
The correct approach is to define the visual task, identify the zone where it must be fulfilled, establish the applicable density or other image criterion, and then find the combination of camera, lens, resolution, position, and infrastructure capable of producing the result.
Pixel Density Should Originate from the Requirement, Not the Catalog
Density needs to be linked to the region of interest, scene geometry, resolution actually recorded, and acceptance criterion. This traceability is what turns px/m into an engineering requirement.
Learn About the IP Video Surveillance and Video Monitoring Design Service
IEC 62676-4 Changed in 2025: DORI Is No Longer the Current Classification
The IEC 62676-4:2014 was the international reference that broadly disseminated the relationship between operational tasks and pixel densities. That edition was withdrawn on October 9, 2025 and replaced by IEC 62676-4:2025, Edition 2.0.
The revision was not merely editorial. IEC itself records a complete redefinition of pixel densities in Clause 6.7, with new test charts in Annex C. The previous system, described during the revision process as MDORII, used six densities: 12.5, 25, 62.5, 125, 250, and 1,000 px/m. The 2025 edition adopted the O2DCPVS, system, with seven densities: 20, 40, 80, 125, 250, 500, and 1,500 px/m.
This is particularly important because many datasheets, calculators, and technical articles available online still use the DORI table of 25 / 63 / 125 / 250 px/m. These numbers remain useful when the design, contract, or equipment explicitly adopts the previous reference, but they should not simply be called “current IEC 62676-4 values.”
The Classic System Associated with DORI
In market practice based on the 2014 edition, the four best-known levels were:
| Historical task | Reference density | Approximate pixels across 0.16 m width |
| Detection | 25 px/m | 4 px |
| Observation | 62.5 to 63 px/m | 10 px |
| Recognition | 125 px/m | 20 px |
| Identification | 250 px/m | 40 px |
These values remain present in manufacturer documentation, design tools, and existing installations. The specific article on DORI in Video-Surveillance Systems should be used to examine the historical terminology and its transition in greater depth.
The O2DCPVS System in IEC 62676-4:2025
The 2025 international edition distinguishes seven operational tasks for visual interpretation by human operators:
| Operational requirement | Pixel density |
| Overview | 20 px/m |
| Outline | 40 px/m |
| Discern | 80 px/m |
| Perceive | 125 px/m |
| Characterize | 250 px/m |
| Validate | 500 px/m |
| Scrutinize | 1,500 px/m |
In application terms, the progression increases the amount of spatial information available: from perceiving movement and outline to characterizing people or vehicles, validating known persons, and, at the most demanding level, carrying out visual scrutiny with a high degree of detail.
The change also shows why it is not correct to automatically convert “250 px/m” into “current identification.” In the 2025 edition, 250 px/m is associated with Characterize, while higher levels of 500 and 1,500 px/m were introduced for more demanding visual tasks.
Another point of caution: this classification refers to human visual-interpretation tasks. Video analytics systems, automatic recognition, and thermal cameras have their own assumptions. A threshold created for a human operator should not automatically be assumed to be an algorithm-performance threshold.
How to Calculate Pixel Density in px/m
The simplest calculation uses the width of the field of view at the target distance.
PPM = H ÷ W
Where:
PPM= pixel density in pixels per meter;H= useful horizontal image resolution, in pixels;W= horizontal scene width in the region of interest, in meters.
Example 1 — 1920 px Image Covering 8 m
PPM = 1920 ÷ 8
PPM = 240 px/m
The number means only that the scene has, on average, 240 horizontal pixels for each meter. The operational conclusion depends on the criterion adopted in the design.
Example 2 — 4K UHD Image Covering 12 m
An image with 3840 horizontal pixels covering 12 m provides:
PPM = 3840 ÷ 12 = 320 px/m
If the same image opens to 24 m:
3840 ÷ 24 = 160 px/m
Therefore, doubling the covered width halves the average density while keeping the same horizontal resolution.
Example 3 — What Maximum Width Can Be Covered?
The formula can also be inverted:
maximum width (m) = horizontal pixels ÷ required density (px/m)
For a horizontal resolution of 1920 px:
| Design criterion | Theoretical maximum width |
| 20 px/m | 96.00 m |
| 40 px/m | 48.00 m |
| 80 px/m | 24.00 m |
| 125 px/m | 15.36 m |
| 250 px/m | 7.68 m |
| 500 px/m | 3.84 m |
| 1.500 px/m | 1.28 m |
For 3840 horizontal pixels, these widths double. The table does not by itself determine a camera or a distance; it only shows the scene width that the resolution can distribute to achieve a given average density.
Turn the Calculation into a Design Criterion
The px/m calculation should precede equipment procurement. When scene width, useful resolution, and visual task are documented, different solutions can be compared by the performance they deliver.
See How We Structure IP Video Surveillance and Video Monitoring Designs
How to Calculate Distance from the Lens Field of View
When the horizontal viewing angle is known, scene width at a distance d can be approximated using the pinhole-camera geometric model:
W = 2 × d × tan(HFoV ÷ 2)
Substituting this width into the density formula:
PPM = H ÷ [2 × d × tan(HFoV ÷ 2)]
And solving for distance:
d = H ÷ [2 × PPM × tan(HFoV ÷ 2)]
Where HFoV is the horizontal field of view of the camera + lens combination at the considered resolution.
Example — 3840 px, 60° HFoV
For an image with 3840 horizontal pixels and a 60° horizontal field of view:
| Required density | Approximate geometric distance |
| 125 px/m | 26.60 m |
| 250 px/m | 13.30 m |
| 500 px/m | 6.65 m |
| 1.500 px/m | 2.22 m |
These values are geometric, not guaranteed performance distances. Focus, lighting, movement, compression, lens, and effective sensor quality may require a more conservative solution.
For detailed design, it is preferable to use the actual field of view specified or modeled for the selected camera and lens, and to validate the installation in the field.
Density Must Be Calculated in the Region of Interest
A common mistake is to calculate px/m using the total width of an area even when the requirement exists only in part of the scene. Another mistake is to use the scene width near the camera to justify performance for a target located farther away.
In perspective, the physical covered width increases with distance. Consequently, pixel density tends to decrease as the target moves farther away in a fixed camera with a given field of view.
The design should clearly identify:
- start and end of the region of interest;
- critical distance;
- physical width at the target plane;
- expected direction of movement;
- approximate target height;
- obstacles and occlusions;
- image region in which performance must be demonstrated.
When the requirement must be met over a range of distances, the calculation should verify the relevant worst case, not just the most favorable point.
Average Density Does Not Mean Uniform Distribution of Detail
The relationship horizontal pixels ÷ width is a powerful design approximation, but it does not describe all image-formation effects.
Wide-angle lenses introduce distortion. Fisheye cameras distribute pixels in a strongly nonuniform way and depend on dewarping. Panoramic and multisensor cameras may use different sensors, overlaps, and crops. Geometric corrections and stabilization may reduce useful resolution in certain regions.
In systems of this type, the designer should evaluate local density in the area of interest, preferably using an appropriate simulation tool and on-site image validation.
How Lens, Focal Length, and Position Change Pixel Density
Focal length, together with sensor size and camera processing, controls the field of view. A tighter field concentrates pixels over a smaller physical width and increases density. A wider field distributes the same pixels over a larger area and reduces density.
This creates a trade-off:
- more coverage tends to mean less detail per unit of width;
- more detail tends to mean a narrower coverage width at the same resolution;
- increasing resolution can recover some detail but increases bandwidth, processing, and storage;
- narrowing the lens can increase density without increasing bitrate in the same proportion, but reduces scene context.
Therefore, a camera should not be sized only by the nominal reach of the lens. Useful range depends on the required imaging task.
Digital Zoom Does Not Increase Captured Density
Digital zoom enlarges existing pixels. It can make viewing easier in the interface, but it does not create new spatial information. If the region was recorded at 100 px/m, enlarging it digitally four times does not turn the recording into 400 px/m of captured information.
Optical zoom, by contrast, physically changes the field of view and can concentrate more pixels on the target, provided focus, resolution, and other conditions remain adequate.
PTZ Requires Additional Care
A PTZ camera can achieve high density when optical zoom is used on a particular target, but that condition does not exist simultaneously in all directions. The design should distinguish:
- guaranteed continuous coverage;
- occasional coverage when the PTZ is directed;
- priority presets;
- automatic tracking;
- loss of view of other areas during movement.
For permanent evidentiary requirements at critical access points, fixed cameras often remain necessary even when a PTZ is present in the area.
Coverage and Detail Need to Be Balanced
Narrowing the field of view increases detail but reduces context; widening the scene increases coverage but distributes pixels over a larger area. The design balances these variables point by point instead of treating resolution or zoom in isolation.
Learn About the IP Video Surveillance and Video Monitoring Design Service
Sensor Resolution, Stream Resolution, and Recorded Resolution
The calculation should use the resolution that actually reaches the decision point.
A camera may have a high-resolution sensor and operate with:
- main stream at reduced resolution;
- sensor crop;
- 16:9 format extracted from a sensor with a different aspect ratio;
- secondary stream for viewing;
- recording at a resolution different from viewing;
- dewarping that redistributes pixels;
- electronic stabilization that crops edges;
- transcoded export.
If the requirement is post-event investigation, the reference should be the recorded and exportable image. If the requirement is live operation, the chain up to the operator workstation should be verified. If both are required, both need validation.
The operator display does not change the density captured by the camera, but it can limit the amount of detail presented simultaneously. A 4K image shown in a small window within a video wall or mosaic may require zooming or opening the camera individually so the operator can use the available detail.
Pixel Density Does Not Replace Image Quality
Two cameras with the same geometric density can produce radically different results. The reason is that px/m describes spatial sampling, not the complete quality of the imaging chain.
IEC 62676-5 and IEC 62676-5-1 address representation and methods for measuring capture-device performance and image-quality testing under environmental conditions. This reinforces that nominal resolution does not exhaust the problem.
Lighting and Signal-to-Noise Ratio
In low light, the camera may increase electronic gain. Gain makes the image more visible but also increases noise. The encoder then needs more bits to represent that noise or applies noise reduction that can erase fine detail.
Thus, a scene that geometrically meets 500 px/m may not deliver equivalent detail if it is underexposed, saturated, noisy, or excessively filtered.
WDR and Backlighting
At entrances with glass doors, loading docks, gates, and façades, contrast may exceed what the camera can represent in a single exposure. WDR can preserve information in bright and dark regions, but it also introduces exposure, motion, and noise trade-offs.
The design should specify the critical scenario, and commissioning should reproduce it where possible.
Motion and Shutter Speed
Pixel density does not correct motion blur. A face hundreds of pixels wide may still be unusable if exposure time produces blur during movement.
In passage areas, vehicle zones, and perimeters, the visual task should be combined with:
- likely target speed;
- direction of movement relative to the camera;
- minimum shutter speed;
- sufficient lighting to support that shutter speed;
- frame rate appropriate to the event.
The 2025 edition of IEC 62676-4 also expanded treatment of the relationship between object speed and number of frames in its application tables.
Compression, Bitrate, and Usable Detail
Calculated density exists before compression, but operators and investigators normally work with compressed video. H.264, H.265, and other codecs remove spatial and temporal redundancies. When the available bitrate is insufficient for scene complexity, blocking, texture loss, and edge degradation appear.
This effect is especially critical in:
- moving vegetation;
- heavy rain;
- water;
- smoke;
- low-light noise;
- crowds;
- scenes with many small objects;
- moving cameras or PTZ movement.
The article on bitrate in IP video surveillance examines CBR, VBR, bitrate peaks, and their impact on network and storage in greater depth.
There is no universal bitrate that guarantees a given “usable” density. Validation needs to assess the resulting image under operating conditions.
How Pixel Density Affects Network and Storage
Pixel density itself does not consume bandwidth. Bandwidth is consumed by the video stream resulting from resolution, codec, frame rate, scene complexity, and compression parameters.
However, projects requiring higher density often lead to:
- higher resolution;
- more cameras to divide a wide area;
- narrower fields of view;
- additional streams;
- retention of images with greater detail;
- greater VMS processing requirements.
Therefore, pixel density needs to be coordinated with the IP video-surveillance infrastructure, bitrate sizing, and the storage calculation for video surveillance and VMS.
A solution that indiscriminately increases resolution to obtain more px/m may simply shift the problem to uplinks, servers, licensing, processing, or storage.
High-Density Images Also Require Infrastructure
Higher resolution, more cameras, or higher-quality streams affect PoE, uplinks, processing, and storage. Infrastructure should be sized together with image requirements, not afterward.
Learn About the Logical Network and Corporate Network Design Service
How to Document Pixel Density in a Design
The px/m value should be traceable. It is not enough to write in the design report that “the cameras shall comply with the IEC 62676 reference.” It is necessary to indicate where, how, and under what conditions the requirement will be verified.
For each critical point, documentation may record:
| Field | Expected content |
| Point identification | Unique camera/point tag |
| Region of interest | Physical area where the requirement applies |
| Operational task | Information that needs to be obtained |
| Adopted criterion | Density in px/m and applicable reference |
| Standards edition | E.g., IEC 62676-4:2025 or a specific contractual requirement |
| Critical distance | Distance from the capture point to the target |
| Target-plane width | Physical width used in the calculation |
| Useful resolution | Resolution of the relevant stream |
| Calculated density | Result in px/m |
| Assumptions | Lighting, lens, position, movement, compression |
| Design evidence | Plan, view, simulation, or calculation record |
| Acceptance evidence | Image/test chart/test record |
This structure makes it possible to compare the design, supplier proposal, installed system, and final test.
Do Not Tie the Design to a Camera Model without Need
A performance-based specification can establish the required density, environmental conditions, functions, interoperability, and test criteria, allowing different technical solutions to be evaluated.
The design stops saying only “install camera X” and starts saying what result must exist in the scene. This improves procurement, technical normalization, and oversight.
How to Use px/m in Video-Surveillance Procurement and Tenders
In competitive processes, the requirement should be objective enough to avoid two opposite failures: a vague specification that accepts any equipment, and an excessively prescriptive specification that reproduces a specific product without functional justification.
Pixel density can help create verifiable criteria, provided the document indicates:
- the adopted standards edition;
- the operational task or image objective;
- the zone where the value must be achieved;
- the resolution and stream considered;
- the minimum test conditions;
- tolerances and measurement method;
- evidence required for acceptance.
A tender that merely requires “DORI identification” without stating the reference, edition, and test method became particularly ambiguous after publication of IEC 62676-4:2025. The international classification changed.
Calculation on the Plan: A Practical Engineering Method
A robust workflow for each point can follow this sequence:
- Define the event, risk, or operational task.
- Mark the region of interest on the plan or model.
- Measure the critical distance and required physical width.
- Define the density criterion and adopted reference.
- Calculate the minimum horizontal resolution or maximum allowable width.
- Select a compatible position and field of view.
- Verify lens, sensor, stream resolution, and environmental conditions.
- Coordinate power, network, bitrate, VMS, and storage.
- Record the calculation in the calculation report and camera schedule.
- Define the test that will demonstrate performance after installation.
Sizing Examples
People Access with 500 px/m Specified
Suppose the design adopts 500 px/m for a 3 m-wide passage zone.
The theoretical minimum horizontal resolution is:
H = 500 × 3 = 1500 pixels
A stream with 1920 horizontal pixels has sufficient geometric resolution for this width. This does not mean that any Full HD camera will guarantee the result: lens, position, lighting, focus, movement, and compression quality still need to be verified.
6 m-Wide Corridor with 250 px/m
H = 250 × 6 = 1500 pixels
Again, 1920 horizontal pixels meet the geometric requirement. If the camera needs to cover 10 m at the same density:
H = 250 × 10 = 2500 pixels
In this case, a 1920 px stream no longer meets the geometric relationship. Alternatives include increasing horizontal resolution, reducing the observed width, repositioning the camera, or dividing the scene among more capture points.
Wide Area with 80 px/m
For a 30 m-wide area:
H = 80 × 30 = 2400 pixels
A horizontal resolution of 2560 px may meet the geometric requirement. If, however, the same area contains a gate where 500 px/m is required, a single wide-view camera will probably not satisfy both objectives simultaneously. The design may need a context camera and another camera dedicated to the critical point.
This is one reason why the number of cameras is a consequence of requirements, not an initial design assumption.
License Plates, Faces, and Other Targets Should Not Be Reduced to a Single ppm Value
Horizontal density in px/m is a general metric. Some tasks require additional criteria.
Faces
For faces, vertical and horizontal angle, lighting, expression, movement, occlusion, and focus quality strongly affect usability. At more demanding levels, IEC 62676-4:2025 increased the reference density and incorporated new test charts, reflecting the need to validate actual detail rather than nominal resolution alone.
License Plates
License-plate reading also depends on:
- physical plate size in the image;
- perspective;
- shutter speed and vehicle speed;
- visible or infrared lighting;
- reflectivity;
- exposure;
- dynamic range;
- camera position;
- OCR/LPR algorithm, when used.
It is not technically correct to state that reaching a given generic ppm automatically guarantees license-plate reading at any speed and under any condition.
Objects and Processes
In industrial processes, substations, yards, and critical environments, the target may not be a person. The requirement may be to read an indicator, verify the position of a switch, confirm leakage, observe a flame, classify a vehicle, or monitor an operational procedure. Density should be related to the smallest relevant detail of the task.
Video Analytics Requires Its Own Criterion
IEC 62676-4:2025 addresses visual tasks for human operators, while automated analysis systems need to be assessed according to their use case. In 2026, the series added IEC 62676-6:2026, dedicated to performance testing and grading of real-time intelligent video-content analysis.
For analytics, the design should specify the expected result, test scenarios, operational difficulty, environmental conditions, false positives, false negatives, and behavior under occlusion and image degradation.
Using only “minimum 250 px/m” as an artificial-intelligence requirement may be inadequate because different algorithms have different needs and because the algorithm’s objective itself may not be identity recognition.
How to Validate Pixel Density during Commissioning
Validation should demonstrate that the installed system reproduces the design assumptions.
The first step is to verify geometry:
- camera at the planned point and height;
- lens and zoom configured according to the design;
- consistent field of view;
- region of interest visible;
- correct stream resolution;
- absence of unplanned cropping or dewarping.
Then the image should be verified under relevant conditions:
- day and night where applicable;
- normal lighting and critical scenario;
- stationary and moving target;
- recording played back in the VMS;
- export when part of the requirement;
- WDR, IR, and other functions configured;
- actual bitrate and frame rate.
Measurement Using a Known Target
One verification method is to use an object or test chart of known dimensions positioned in the critical zone and check how many image pixels correspond to the measured dimension.
If a 1 m target occupies 520 horizontal pixels in the recorded image, density at that point is approximately 520 px/m.
For more rigorous standards-based criteria, the methods and test charts prescribed by the adopted edition of the standard should be followed instead of improvising an untraceable visual ruler.
Common Errors in Pixel-Density Designs
Using the Sensor’s Nominal Resolution
The sensor may have more pixels than the recorded stream. The calculation needs to use the actual chain.
Calculating at the Wrong Distance
The value needs to be met in the critical zone, especially at the farthest point when that is the worst case.
Confusing Optical Reach with Performance
A lens may be able to “see” a target at a great distance without providing enough detail for the task.
Treating Legacy DORI as the Current Table without Declaring the Edition
After October 2025, this creates technical ambiguity. New designs should explicitly state which document and classification are being used.
Assuming that Meeting ppm Guarantees Identification
Density is a spatial condition, but focus, lighting, movement, compression, angle, and exposure can make the result unusable.
Using Digital Zoom to Justify the Calculation
Digital enlargement does not create captured pixels.
Specifying a Single Value for the Entire Installation
Perimeter, gatehouse, parking lot, loading dock, corridor, and critical room may have very different tasks. Density should follow the risk and operational objective of each zone.
Relationship between Pixel Density and Video-Surveillance Design
Pixel density is an engineering tool within a broader process. An IP Video Surveillance and Video Monitoring Design should connect risk, operational requirement, coverage, camera, lens, network, PoE, bitrate, VMS, storage, cybersecurity, documentation, and commissioning.
The calculation gains value when it appears traceably in plans, tables, and calculation records and can be compared against the installed system.
A consistent chain is:
requirement → region of interest → density → geometry → camera/lens → stream → infrastructure → test → evidence.
If one of these links is undocumented, acceptance tends to depend on subjective perception.
How to Turn the Calculation into a Contractible Requirement
Robust technical wording should not be limited to “camera shall have minimum resolution of 4 MP” or “shall comply with DORI.” The document may establish, for example, that a given region of interest shall provide the specified minimum density in the recorded image, according to the stated standards edition, under defined operating conditions, with a field test and evidence attached to the commissioning report.
This form of specification allows the market to propose different sensor, lens, and architecture combinations while keeping the engineering outcome as the comparison criterion.
It also allows the owner to address construction deviations objectively. If the camera was moved, the lens changed, or the stream reduced, the impact can be recalculated and retested.
Specify by Performance and Verifiable Acceptance
A mature specification links requirement, region of interest, calculation record, and field test. Procurement then stops depending on brand or isolated megapixel counts and starts requiring a technically demonstrable result.
Learn About the IP Video Surveillance and Video Monitoring Design Service
Final Considerations
Calculating pixel density in video surveillance is mathematically simple, but using it correctly requires engineering context. The relationship horizontal pixels ÷ scene width turns resolution and geometry into a verifiable parameter, but the result only has meaning when associated with an operational task, a region of interest, and actual image conditions.
Publication of IEC 62676-4:2025 made it even more important to declare the standards edition used. Traditional DORI levels remain relevant for systems and documents based on the previous edition, but the current international edition redefined the densities and adopted the seven-level O2DCPVS model, reaching 1,500 px/m for the highest-detail tasks.
For new designs, the safest practice is to define required performance before equipment, calculate geometry, document assumptions, coordinate the solution with network and storage, and finish with field testing. In this way, pixel density ceases to be a datasheet table and fulfills its real function: linking a security requirement to a technically verifiable image.
Technical References
[1] IEC. IEC 62676-4:2025 — Video surveillance systems for use in security applications — Part 4: Application guidelines. 2025. Available at: https://webstore.iec.ch/en/publication/83425.
[2] IEC. IEC 62676-4:2014 — Video surveillance systems for use in security applications — Part 4: Application guidelines [superseded edition]. 2014. Available at: https://webstore.iec.ch/en/publication/7353.
[3] IEC. IEC 62676-1-1:2013 — Video surveillance systems for use in security applications — Part 1-1: System requirements — General. 2013. Available at: https://webstore.iec.ch/en/publication/7347.
[4] IEC. IEC 62676-5-1:2024 — Data specifications and image quality performance for camera devices — Environmental test methods for image quality performance. 2024. Available at: https://webstore.iec.ch/en/publication/62442.
[5] IEC. IEC 62676-6:2026 — Performance testing and grading of real-time intelligent video content analysis devices and systems. 2026. Available at: https://webstore.iec.ch/en/publication/59704.
[6] AXIS COMMUNICATIONS. Pixel density based on IEC 62676-4:2025. 2026. Available at: https://whitepapers.axis.com/en-us/pixel-density-based-on-iec-62676-4-2025.
[7] AXIS COMMUNICATIONS. Pixel density based on IEC 62676-4:2014. 2026. Available at: https://whitepapers.axis.com/en-us/pixel-density-based-on-iec-62676-4-2014.
Frequently Asked Questions
Divide the useful horizontal image resolution by the horizontal scene width, in meters, in the region of interest. An image with 1920 px covering 8 m provides 240 px/m.
Px/m means pixels per meter and expresses how many horizontal image pixels represent one meter of the scene at the analyzed plane.
Not necessarily. Density also depends on field-of-view width. A high-resolution camera covering a very wide area can provide fewer px/m than a lower-resolution camera with tighter framing.
The classic table based on IEC 62676-4:2014 uses 25, 62.5, 125, and 250 px/m for detection, observation, recognition, and identification. These values are legacy values from the previous edition and should not be presented as the current IEC 62676-4:2025 classification.
The 2025 edition replaced the 2014 edition and completely redefined the density system, adopting the O2DCPVS model with seven levels: 20, 40, 80, 125, 250, 500, and 1,500 px/m.
Not as the current classification in the 2025 edition. In the current model, 250 px/m corresponds to the Characterize level. Designs using the historical concept of identification at 250 px/m should explicitly declare the previous reference or the adopted contractual requirement.
No. Digital zoom only enlarges pixels already captured. It does not create new spatial information and does not turn a low-density recording into an image with higher actual density.
The resolution actually available for the task should be used. If the requirement is investigation, the reference should be the recorded and exportable resolution; if it is live operation, the viewing chain should also be verified.
No. Px/m measures spatial sampling. Lighting, focus, angle, movement, shutter speed, noise, and compression can degrade usable detail, so the design needs to provide for field testing.
Verify position, lens, field of view, and actual resolution and use a target or test chart of known dimensions in the critical zone. For standards compliance, apply the test method corresponding to the adopted edition of the standard.
It should not be used automatically. The classic levels were developed for imaging and visual-interpretation tasks. Analytics needs its own requirements and tests; IEC 62676-6:2026 specifically addresses assessment of intelligent video analysis.
State the standards edition, region of interest, operational task, px/m value, reference stream, test conditions, and evidence required for acceptance. Avoid requiring only megapixels or writing generically 'according to DORI'.
Complementary Technical Materials
Related Solutions
Related Services
- IP Video Surveillance and Video Monitoring Design
- Integrated Electronic Security System Design
- Logical Network and Corporate Network Design
Main Content on the Topic
- ABNT NBR IEC 62676 and IEC 62676: Parts, Requirements, and Application in Video-Surveillance Design
- Video-Surveillance Monitoring Points: Specification, Pixel Density, and Validation According to IEC 62676
- Pixel Density and DORI Requirements in Video-Surveillance Systems
- Planning Video-Surveillance Architecture According to ABNT NBR IEC 62676
- Complete Guide to Video Surveillance Systems