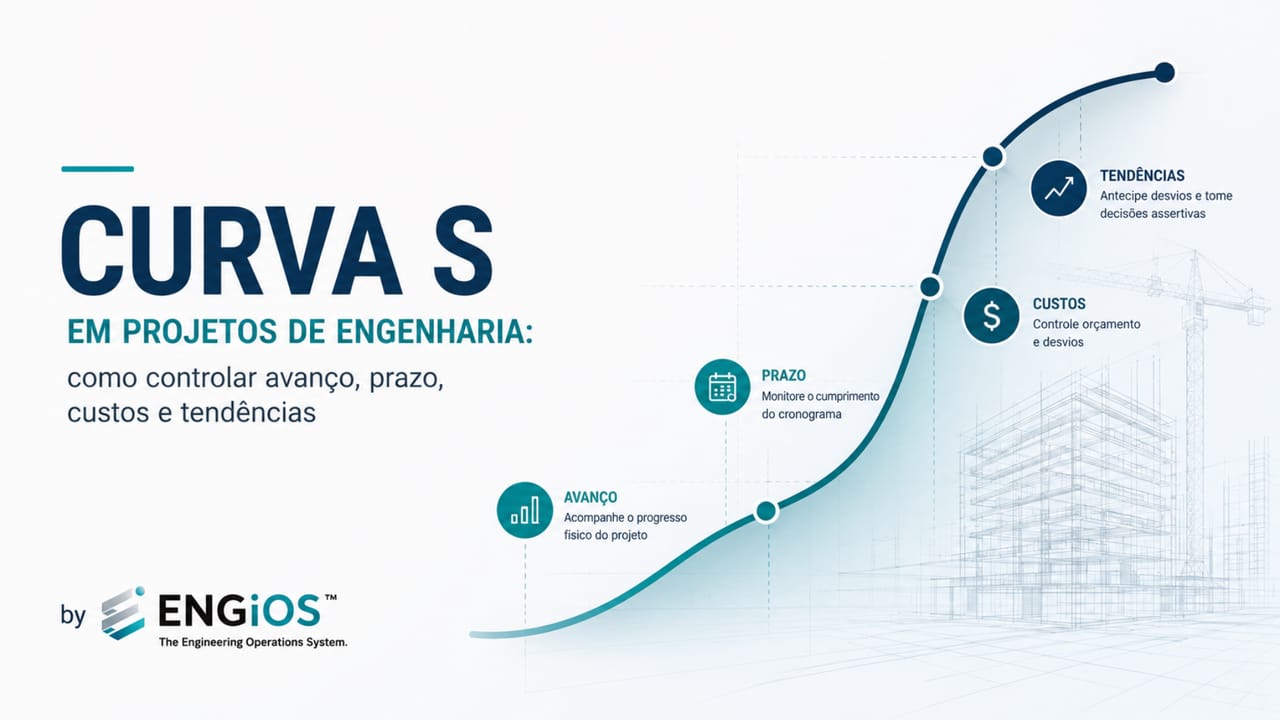
Learn how to use the S-Curve to control progress, schedule, costs, measurements, and trends in engineering projects.
Check it out!
The S-Curve is one of the most widely used visualizations in project planning and control. It makes it possible to compare the cumulative evolution of planned, actual, and forecast values over time, supporting analyses of physical progress, schedule, costs, cash outflows, productivity, and trends.
However, the curve does not create control by itself. A visually correct chart can be generated from an incomplete scope, a schedule without logic, subjective percentages, or costs with incompatible data dates. In that case, the appearance of precision masks a fragile foundation.
In engineering projects, the S-Curve must be part of an integrated Project Controls system. The WBS defines what will be measured, the schedule establishes when the work should occur, progress criteria determine how progress will be recognized, the baseline records the approved reference, and the control cycle compares results, investigates variances, and updates the forecast.
The management question is not merely “is the actual line below the planned line?” It is necessary to understand where the variance is concentrated, which deliverables or contracts were affected, what cause explains the variation, what the completion trend is, and what decision must be made.
What is an S-Curve?
An S-Curve is a chart of cumulative values distributed over time. The horizontal axis shows periods, dates, or project phases. The vertical axis shows a cumulative measure such as progress percentage, cost, hours, quantities, commitments, or cash outflow.
The shape often resembles the letter S because many projects exhibit three behaviors:
- an initial period of mobilization and gradual production;
- an intermediate period of greater intensity and accelerated growth;
- deceleration during testing, corrections, closeout, and demobilization.
This shape is not mandatory. Projects, contracts, and work packages may present different curves depending on execution strategy, resource distribution, procurement, seasonality, constraints, and type of deliverable.
A curve must represent the expected behavior of the project rather than being artificially adjusted to look like a perfect S.
What management problem does the S-Curve solve?
The S-Curve consolidates thousands of activities, documents, quantities, or transactions into a cumulative view that makes it possible to perceive distance from the plan and changes in trend.
| Management problem | Consequence | S-Curve contribution | Expected benefit |
| Large volume of activities | Difficulty understanding overall performance | Cumulative consolidation of plan and actual | Executive view of progress |
| Progress shown only by period | Local fluctuations hide the trend | Cumulative comparison over time | Trajectory reading |
| Extensive and difficult-to-read schedule | Stakeholders cannot quickly identify the variance | Synthetic representation of performance | Clearer management communication |
| Physical measurement disconnected from schedule | Percentages do not indicate whether the project is ahead or behind | Relationship between cumulative progress and data date | Time-based progress control |
| Costs analyzed without a physical reference | Spending can be confused with performance | Comparable physical and financial curves | Better interpretation of cash outflow |
| Trend change not perceived | Actions are taken after the impact | Slope and forecast analysis | Earlier intervention |
| Contractors use different criteria | Percentages cannot be consolidated | Common weighting and cutoff rules | Comparability across packages |
| Rebaselining erases history | The project loses its original reference | Preservation of baselines and versions | Traceability of decisions |
The S-Curve does not replace the detailed schedule. It highlights that a behavior exists that must be explained at the level of packages, activities, causes, and responsibilities.
Why does the curve usually have an S shape?
At the beginning of a project, teams are still being mobilized, designs and approvals are under development, and procurement may not have reached its peak. Cumulative production grows slowly.
In the intermediate phase, several work fronts operate simultaneously, resources are mobilized, and the project reaches a higher production rate. The curve becomes steeper.
Near closeout, the remaining volume decreases, but final items may require tests, corrections, documentation, training, and acceptance. The curve loses slope again until it reaches the planned total.
| Curve segment | Behavior | Management question |
| start | slow growth | are mobilization and releases occurring as planned? |
| acceleration | increasing slope | is capacity growing at the required rate? |
| peak production | highest progress rate | do resources and interfaces support the planned intensity? |
| deceleration | decreasing slope | is the remaining balance actually smaller, or are there hidden open items? |
| closeout | approaching the total | are acceptance criteria, documents, and commissioning complete? |
Premature deceleration may indicate loss of productivity, a constraint, lack of available work fronts, supplier delay, or increased rework. Sudden acceleration may represent real recovery, but it may also reflect a change in criteria, late data entry, or overly optimistic measurement.
What types of S-Curves can be used?
The term “S-Curve” does not automatically identify the variable represented. The legend, unit, source, and criterion must be explicit.
| Curve type | What it accumulates | Application | Main caution |
| weighted physical progress | percentage of deliverables or packages | track production and scope completion | weights and criteria must be approved |
| physical quantity | meters, units, tons, or points | repetitive and measurable services | different quantities may have different complexities |
| technical hours | planned, consumed, or aggregated hours | consulting engineering and professional services | hours consumed do not prove an accepted deliverable |
| budgeted cost | cumulative planned value | financial planning | does not necessarily represent cash or actual cost |
| actual cost | expenses or recognized costs | financial monitoring | accounting may occur after execution |
| commitments | contracts and purchase orders issued | procurement management | commitment is neither cash outflow nor physical progress |
| cash outflow | planned and actual payments | financial flow | payment terms may advance or delay values |
| billing | revenue or invoiced measurements | contract management | billing should not be confused with physical production |
| labor | labor hours or cumulative headcount | mobilization and productivity | more people do not necessarily mean more production |
| earned value | planned value, earned value, and actual cost | schedule and cost integration | requires reliable baseline and measurement |
Different curves may be required within the same project. Comparing physical, financial, commitment, and cash-outflow curves helps identify situations that a single measure does not reveal.
Are physical, financial, and physical-financial curves the same thing?
No.
The physical curve represents the evolution of work performed according to measurement criteria. The financial curve may represent budget, commitments, costs, billing, or cash outflow. The term “physical-financial” means that both dimensions are analyzed in relation to each other, not that they can be mixed into a single percentage without a rule.
| Situation | Possible interpretation |
| physical below plan and financial below | execution or procurement delay |
| physical below and financial near plan | financial advance, mobilization, materials, or low productivity |
| physical near plan and financial above | price increases, change, unproductive cost, or additional scope |
| physical above and financial below | favorable productivity, cost not yet recognized, or pending measurement |
| high commitments and low physical progress | procurement placed but not yet delivered or incorporated into the asset |
| high cash outflow and low recognized cost | advances or front-loaded commercial terms |
Interpretation must consider the contract model, measurement regime, accounting, procurement, and data maturity.
What does the S-Curve not show by itself?
The S-Curve is an aggregated view. This characteristic is useful for management, but it can hide important differences.
By itself, it does not show:
- critical path;
- precedence logic;
- activities responsible for the variance;
- causes of delay;
- quality of completed work;
- risks not yet materialized;
- changes under evaluation;
- specific contractual commitments;
- resource availability;
- pending approvals;
- documentation completeness;
- probability of recovery;
- quality of the data used.
Two projects may show the same cumulative percentage and have completely different risks. One may be delayed in activities with float; another may be close to the overall plan but have a critical equipment item threatening the completion date.
The curve signals. The schedule, records, and cause analysis explain.
A reliable S-Curve begins before the chart. Scope, progress criteria, weights, data date, and sources must be governed; otherwise, the visualization merely organizes an inconsistent foundation.
What are the prerequisites for a reliable S-Curve?
The curve must be the consequence of a control model, not the starting point.
Structured scope
The WBS in engineering projects organizes scope into deliverables and work packages. Each element must have a description, boundary, owner, and relationship with schedule, costs, and contracts.
Without a common structure, different areas may measure incompatible objects and consolidate them as if they represented the same basis.
Logic-driven schedule
The schedule must contain activities, durations, relationships, milestones, calendars, constraints, and interfaces sufficient to represent how the project will be executed.
Distributing percentages by month without a connection to activities and deliverables creates a budget curve, but not necessarily a technical execution reference.
Progress criteria
Each package must define how progress will be recognized. Criteria may use completed units, weighted milestones, 0/100 rules, 50/50 rules, level of effort, or other suitable methods.
The criterion must be established before execution and tied to verifiable evidence.
Coherent weights
The weight defines how much each package contributes to total progress. It may be based on cost, hours, technical effort, quantity, earned value, or a methodologically defined combination.
Arbitrary weights allow manipulation of the overall percentage and make comparisons difficult.
Approved baseline
The baseline records the reference against which performance will be compared. It must have a version, date, assumptions, scope, and approval.
Rebaselining must preserve the original plan and clearly indicate when a new baseline was authorized.
Cutoff calendar
Planned, actual, costs, risks, and changes must represent the same data date. Data from different periods produce false comparisons.
Data governance
Sources, owners, formulas, validation rules, exceptions, and approvals must be documented. The Indicators, Dashboards, and Executive Reports solution structures this relationship between data, indicator, and decision.
How should progress weights be defined?
There is no universal criterion. The method must represent the effort or value of the work without creating distorted incentives.
| Weighting basis | Advantage | Limitation | Typical application |
| budgeted cost | integrates with budget and EVM | expensive items may dominate physical progress | construction and supply |
| planned hours | represents professional effort | efficiency and technical value may vary | design and consulting engineering |
| quantities | simple and auditable | units may have different complexity | repetitive services |
| weighted milestones | recognizes verifiable stages | requires prior definition of weights | documents, equipment, and systems |
| technical value | represents importance of the deliverable | may involve judgment | studies and intellectual products |
| hybrid composition | adapts to the project | requires governance and documentation | multidisciplinary projects |
Weight must not be confused with criticality. An item with low weight may determine the critical path or safety. The S-Curve measures cumulative contribution; the schedule and risk process assess criticality.
How should progress be measured in consulting engineering projects?
In intellectual services, consumed hours are not sufficient to recognize progress. A document may require many hours and still not contain usable or accepted content.
A milestone-based approach may consider:
| Deliverable milestone | Illustrative cumulative percentage | Evidence |
| assumptions and inputs validated | 10% | requirements and received-data record |
| initial development completed | 35% | internal version available |
| interdisciplinary review completed | 55% | consolidated comments |
| issued for client review | 70% | submission record |
| comments addressed | 85% | response matrix |
| technical approval | 95% | approval record |
| final issue and incorporation into the record | 100% | controlled final document |
The percentages are only examples. They must reflect the nature of the deliverable, the contract, the approval process, and the remaining effort.
Process, Workflow, and Technical Approval Management makes it possible to relate statuses, owners, deadlines, and evidence to recognition of progress.
How should progress be measured in procurement and supply?
Equipment and materials have stages that begin before field delivery.
| Supply milestone | Example cumulative progress |
| specification and requisition approved | 5% |
| supplier contracted | 15% |
| vendor documents approved | 25% |
| manufacturing started | 35% |
| manufacturing completed | 65% |
| factory inspection and tests approved | 75% |
| shipment | 82% |
| site delivery | 90% |
| installation | 96% |
| testing and acceptance | 100% |
Payment may occur at different percentages. For this reason, the physical curve, commitment curve, and cash-outflow curve must be distinguished.
How should progress be measured in construction and implementation?
In execution activities, measurement may use installed quantities, completed stages, or weighted milestones.
Examples:
- meters of cable tray installed and accepted;
- network points completed and certified;
- equipment installed, connected, and tested;
- cubic meters of approved concrete;
- panels installed, energized, and commissioned;
- areas released and accepted.
Quantity must be tied to quality criteria. Work performed but rejected or incomplete should not receive the same progress credit as an accepted deliverable.
How do you build the S-Curve from the plan?
Management development can follow this sequence:
- define the objective and variable of the curve;
- confirm scope and control structure;
- select the consolidation level;
- establish progress criteria;
- assign weights to packages;
- distribute planned progress according to the schedule;
- calculate values by period;
- accumulate values over time;
- approve the baseline and its assumptions;
- capture actual progress at the data date;
- validate evidence and consistency;
- calculate cumulative actual progress;
- update the future projection;
- compare baseline, actual, and forecast;
- analyze causes, impacts, and decisions.
The tool may be a spreadsheet, planning system, Project Controls platform, or analytics environment. Quality depends more on rules and data than on the software used.
Planned, actual, and forecast: which lines should appear?
A mature S-Curve may show more than one reference.
| Line | Meaning | Question answered |
| original baseline | initially approved plan | where should the project be according to the original commitment? |
| current baseline | approved plan after authorized changes | what is the current formal reference? |
| actual | effectively validated progress | where is the project at the data date? |
| forecast | most likely projection | where is the project likely to end up, and when? |
| recovery plan | scenario with proposed actions | what trajectory would be possible with the planned response? |
The actual line should not extend beyond the data date. Future projection must be identified as forecast so estimated data is not presented as confirmed progress.
Baseline, actual, and forecast must remain separate. Mixing the approved reference, validated progress, and projection reduces transparency and allows variances to be absorbed without a formal decision.
See how to structure governance, decision authority, and decisions in engineering projects.
How do you interpret the S-Curve?
Vertical distance
The vertical distance between planned and actual represents the cumulative difference in the variable being analyzed. In a physical curve, it indicates unperformed progress or progress above plan.
This difference does not directly indicate how many days the project is delayed. The relationship depends on slope, critical path, and distribution of work.
Horizontal distance
Horizontal distance may suggest how long it would take to reach the same cumulative level, but it should not be used as an automatic project-delay calculation.
A critical activity and an activity with float may contribute equally to the percentage but produce different effects on the completion date.
Slope
Slope represents the cumulative production rate. When the actual line loses slope relative to the plan, production is decelerating.
An increasing slope may indicate recovery, additional mobilization, a change of work front, or concentrated entry of measurements.
Inflection point
The inflection point represents a relevant change in the growth rate. Shifts relative to the plan may indicate late mobilization or a delayed production peak.
Plateau
An almost horizontal segment indicates little progress. It may be normal between phases, but it may also signal lack of available work fronts, approval blockage, supplier waiting time, or incomplete closeout.
Approaching the total
The curve may remain close to 100% for a long period. The final percentages often concentrate punch-list work, final documents, tests, training, and acceptance. Declaring 99% does not mean the asset is ready to operate.
What decision should be made for each behavior?
| Observed behavior | Hypotheses to investigate | Possible decision |
| actual below plan and lower slope | productivity, constraints, resources, or rework | recovery plan and removal of blockers |
| actual below plan but higher slope | recovery underway | verify sustainability and impact on quality |
| actual above plan | real acceleration or inflated criterion | validate evidence and effects on resources and costs |
| physical curve on track and financial above | overrun, advance payment, or price effect | review costs, commitments, and changes |
| financial curve below and physical on track | costs not yet recognized or favorable condition | reconcile data and update forecast |
| forecast does not reach baseline | target likely infeasible | escalate decision, revise strategy, or approve change |
| curve near 100% without closeout | critical balance, documentation, or acceptance | detail completion backlog and readiness criteria |
| abrupt variation between periods | late entry or change in rule | audit data, cutoff, and measurement criteria |
The S-Curve should always lead to analysis at the level of the packages responsible for the variance.
How do you locate the source of the variance?
Overall progress must be decomposable. A recommended architecture allows drilling down from the executive view to:
- program or portfolio;
- project;
- contract;
- discipline;
- area or location;
- work package;
- deliverable;
- activity.
The Pareto Diagram in project management helps identify which categories concentrate the variance. The Ishikawa Diagram organizes causal hypotheses. PDCA drives improvement, while 5W2H structures the response.
The management sequence can be represented as:
S-Curve identifies the trend → Pareto locates the concentration → Ishikawa investigates causes → prioritization matrix selects responses → 5W2H organizes actions → KPI verifies effectiveness.
S-Curve and schedule: what is the difference?
The schedule represents activities, logic, durations, milestones, and constraints. The S-Curve consolidates progress or another variable over time.
| Aspect | Schedule | S-Curve |
| primary unit | activities and milestones | cumulative value |
| shows precedences | yes | no |
| identifies critical path | yes | no |
| communicates overall trend | to a limited extent | yes |
| allows detailed decomposition | yes | depends on structure |
| measures cumulative progress | can measure | its central function |
| executive use | may be complex | more synthetic |
| explains cause of variance | requires analysis | does not explain by itself |
The two tools are complementary. The curve without a schedule loses its logic; the schedule without synthesis can make executive communication difficult.
S-Curve, Gantt chart, histogram, and cash flow: which one should you use?
| Tool | Main question | Primary use |
| Gantt chart | when does each activity occur? | scheduling and time-based communication |
| network diagram | how do activities depend on each other? | logic and critical path |
| S-Curve | how does cumulative evolution compare with the plan? | performance and trend |
| resource histogram | how many resources are needed in each period? | mobilization and capacity |
| cash flow | when do financial inflows and outflows occur? | financial planning |
| physical-financial schedule | how are execution and values distributed over time? | measurement, budgeting, and contracting |
| dashboard | which exceptions and indicators require attention? | communication and governance |
| Earned Value Management | what is the integrated schedule and cost efficiency? | performance analysis and forecast |
The choice starts with the management question. One tool does not need to replace another when they answer different questions.
Are the S-Curve and Earned Value Management the same thing?
No. The S-Curve is a way of representing cumulative values. Earned Value Management uses specific concepts and calculations to integrate scope, schedule, and cost.
An EVM visualization may show curves for:
- Planned Value — PV;
- Earned Value — EV;
- Actual Cost — AC.
The differences between these lines make it possible to calculate variances and indices. However, EVM depends on a performance measurement baseline and reliable progress criteria.
ISO 21512:2024 provides guidance for implementing Earned Value Management. The topic will be addressed in greater depth in a dedicated article in this series.
How can the S-Curve be used across the project life cycle?
| Phase | Application | Decision supported |
| feasibility | compare preliminary investment and execution profiles | select alternative and implementation window |
| planning | consolidate progress, resource, and cost baseline | approve plan and capacity |
| design and engineering | control deliverables, revisions, and approvals | prioritize disciplines and remove blockers |
| procurement | track commitments, manufacturing, and delivery | decide contracting, expediting, and shipment |
| construction | measure quantities, productivity, and physical progress | mobilize resources and recover work fronts |
| commissioning | track tested systems, open items, and readiness | authorize energization or operation |
| closeout | control documentation, punch list, and acceptance | approve handover and operational transition |
The curve should change in level of detail and variable according to the phase. A conceptual investment curve should not be confused with an execution measurement baseline.
How does the S-Curve relate to contracts and measurements?
In engineering and construction contracts, the curve can support:
- measurement planning;
- billing and cash-outflow forecasting;
- progress validation;
- milestone monitoring;
- comparison between contracts;
- productivity analysis;
- delay assessment;
- remaining-balance projection;
- change control;
- support for recovery plans.
Contract, Scope, and Deliverable Management must ensure that each measurement is linked to a deliverable, evidence, and contractual criterion.
The contractual curve, the contractor’s internal curve, and the owner’s consolidated curve may have different levels. Governance must define how they will be reconciled.
S-Curve in public-works inspection and Law 14.133 contracts
In public works, the S-Curve expands its role: in addition to supporting Project Controls, it can serve as an instrument for reading contract execution, provided that reported progress is supported by objective criteria and verifiable evidence. Law No. 14.133/2021 does not make the S-Curve a mandatory document, but it requires monitoring and inspection of contract execution. In this context, the curve is useful when it helps the inspector and contract manager see trends, concentration of delay, and consistency among declared progress, measurement, and schedule.
The central point is not to confuse a chart percentage with an accepted service. In a public contract, physical progress feeding the curve must derive from a controlled basis: verified quantities, completed milestones, inspections, tests, field records, and criteria established in the contract. The article Evidence-based inspection in public works explains how to structure this traceability chain.
| S-Curve reading | Inspection question | Evidence to compare |
| actual below planned | which work fronts explain the variance? | schedule, daily construction report, inspections, and constraints |
| abrupt jump in progress | was there real production or a change in criterion? | measurements, calculation records, and field records |
| financial above physical | is there an advance payment, early supply, or distortion? | payment terms, materials, and measurement certificates |
| curve near 100% | is the object truly ready for acceptance? | punch list, tests, documentation, and receipt |
| rebaselined baseline | was the change formally justified and approved? | contract decision, previous schedule, and change matrix |
The Daily Construction Report (RDO) helps explain the temporal origin of variances. The Construction Measurement Certificate shows how quantities and evidence reach formal certification. The article How to inspect a public work organizes these instruments within a complete method for monitoring execution.
It is also important to separate technical reading from contractual decision-making. The contract inspector and contract manager have different responsibilities. The inspector may identify loss of pace, measurement inconsistency, or milestone risk; the manager consolidates information, coordinates actions, and forwards decisions that exceed field inspection. The S-Curve works best when this governance is defined.
In public works, the S-Curve should be read together with the schedule, RDO, measurements, and evidence. The chart signals the variance; technical inspection verifies its cause and consistency.
Learn about Technical Support for Inspection of Construction and Engineering Contracts
How can front-loading and weight distortion be avoided?
Front-loading occurs when excessive weights or values are concentrated in early stages, allowing a large share of progress or billing to be recognized before the main value has actually been delivered.
Risk signals include:
- mobilization with disproportionate weight;
- preliminary documentation representing a large share of the package;
- supply recognized before manufacturing or delivery;
- progress based on purchase but without installation and testing;
- hours consumed used as the sole criterion;
- long activities with subjective percentages;
- small final balance for critical commissioning tasks.
Weight review should consider effort, cost, risk, deliverable value, and remaining difficulty. The owner should avoid accepting a curve that reduces its ability to require completion and correction.
How should the baseline and rebaselining be governed?
The baseline must include:
- identification and version;
- corresponding scope;
- approval date;
- responsible authority;
- assumptions and constraints;
- calendar;
- progress criteria;
- weight structure;
- incorporated risks;
- supporting documents.
When an approved change alters the plan, the organization may update the baseline. However, it must preserve:
- original reference;
- cumulative variances;
- reason for the change;
- authorized impacts;
- effective date;
- decision and authority level;
- comparison between versions.
Replanning without control turns the current plan into a portrait of actual performance and eliminates its performance-measurement function.
How do you integrate the S-Curve, risks, and forecast?
The actual curve shows the validated past. The forecast must incorporate the current state and known future events.
Examples of information that should influence the projection include:
- critical supplier delay;
- recent productivity;
- access restriction;
- incomplete detailed design;
- change under evaluation;
- pending permit;
- risk of operational shutdown;
- team unavailability;
- shutdown window;
- failed tests;
- remaining rework;
- recovery plan.
The forecast should not be a simple extension of the latest slope. Projects contain discrete events and constraints that alter future capacity.
The Risk Matrix in Engineering Projects supports classification. Governance defines when risk must alter the projection, consume contingency, or be escalated.
Example applied to a multidisciplinary project
Consider a project with four major workstreams:
| Major workstream | Weight in total progress |
| engineering and design | 20% |
| procurement and supply | 35% |
| implementation and installation | 35% |
| testing, commissioning, and acceptance | 10% |
At the fourth-month data date, plan and actual are:
| Major workstream | Planned workstream progress | Actual workstream progress | Planned contribution to total | Actual contribution to total |
| engineering and design | 85% | 72% | 17.0% | 14.4% |
| procurement and supply | 50% | 30% | 17.5% | 10.5% |
| implementation and installation | 20% | 18% | 7.0% | 6.3% |
| testing and commissioning | 0% | 0% | 0% | 0% |
| cumulative total | 41.5% | 31.2% |
The overall variance is 10.3 percentage points. However, the table shows that most of the variance lies in procurement, not installation.
Detailed analysis identifies delays in approving vendor documents and releasing manufacturing. Pareto shows that three categories concentrate most of the cycle time. Ishikawa points to hypotheses related to incomplete requirements, interface responsibilities, and fragmented submissions.
The schedule confirms that two equipment items will affect the critical path. The revised forecast indicates that, without action, implementation will finish six weeks after the baseline.
Governance decides to:
- create a task force for critical documents;
- prioritize reviews according to critical-path impact;
- make new submissions conditional on completeness checks;
- expedite suppliers using weekly milestones;
- update forecast and recovery plan;
- monitor first-submission approval KPI;
- verify effectiveness in subsequent cycles.
The S-Curve signaled the variance. Decomposition, schedule analysis, and causal analysis transformed the signal into a decision.
Example of distortion caused by document count
Consider 100 engineering documents:
- 70 simple documents with a total weight of 35%;
- 20 intermediate documents with a total weight of 30%;
- 10 critical documents with a total weight of 35%.
If 65 simple documents are issued, a quantity-based curve will indicate 65% document progress. However, if only two critical documents are complete, the weighted curve may show much lower progress.
| Method | Apparent result | Interpretation risk |
| number of documents issued | 65% | ignores complexity and importance |
| hours consumed | depends on recorded effort | may recognize inefficiency as progress |
| technical weight by deliverable | represents relative value | requires criteria and governance |
| approval milestone | recognizes a verifiable status | depends on the client review process |
The method must represent what the project considers delivery of value. Quantity, effort, and acceptance answer different questions.
Which indicators should accompany the S-Curve?
The curve gains value when combined with indicators that help explain the trend.
| Indicator | Question answered |
| progress variance | what is the cumulative difference from the plan? |
| production rate | what was the progress per period? |
| milestone adherence | how many milestones were achieved on time? |
| first-submission approval | what is the quality of the deliverables? |
| approval cycle time | where are queues and delays? |
| productivity | how much is produced per unit of resource? |
| rework percentage | how much capacity is being consumed by corrections? |
| pending changes | what impact has not yet been incorporated? |
| milestone risk | which dates have the greatest exposure? |
| completion forecast | what is the most likely date? |
The article on KPIs and performance indicators presents criteria for defining formulas, sources, thresholds, and associated decisions.
What benefits does the S-Curve provide to management?
| Dimension | Benefit |
| scope | consolidation of deliverable and package progress |
| schedule | early perception of loss or recovery of pace |
| costs | comparison among work, commitments, and cash outflow |
| resources | indirect assessment of mobilization and productivity |
| contracts | support for measurements, forecasts, and recovery plans |
| risks | identification of trends requiring investigation |
| governance | synthetic communication for committees and executives |
| quality | relationship among progress, rework, and acceptance |
| Owner’s Engineering | independent validation of contractor information |
| benchmarking | preservation of historical execution profiles |
The benefit is not in producing a prettier line, but in reducing the interval between the emergence of a variance and decision-making.
How does the S-Curve contribute to technical records and benchmarking?
Historical curves help understand the actual profile of projects, contracts, and deliverables.
The record can support:
- mobilization estimates;
- distribution of technical hours;
- phase durations;
- cash-outflow profiles;
- productivity by discipline;
- comparison between suppliers;
- definition of weights and milestones;
- ramp-up analysis;
- commissioning planning;
- identification of delay patterns;
- evaluation of recovery plans.
Benchmarking requires context. Curves should not be compared without considering scope, complexity, maturity of definition, location, technology, contract strategy, resources, and constraints.
In consulting engineering, qualified historical references improve the accuracy of proposals, schedules, estimates, and recommendations to the client.
How do you implement S-Curve use in 12 steps?
- Define the management question. Determine whether the curve will track physical progress, costs, hours, commitments, or cash outflow.
- Confirm the scope and WBS. Ensure that all packages are represented without overlap.
- Choose the control level. Define which views will be executive, management, contractual, and operational.
- Establish progress criteria. Link each recognition to verifiable evidence.
- Define weights and units. Document the method, basis, and approval responsibilities.
- Integrate the schedule. Distribute progress according to logic, dates, and milestones.
- Approve the baseline. Record version, assumptions, and decision authority.
- Define the cutoff calendar. Synchronize planning, measurements, costs, risks, and changes.
- Implement data validation. Verify completeness, duplication, quality, and adherence to criteria.
- Structure forecast and scenarios. Separate actual, projection, and recovery plan.
- Link the chart to management routines. Every relevant variance should have analysis, an owner, and a decision.
- Preserve history and learn. Use completed curves for benchmarking and planning improvement.
Implementation should start with a simple and auditable basis. Sophistication without reliability increases the appearance of precision, but not the maturity of control.
Common errors when using the S-Curve
Creating the curve before structuring scope
Percentages are distributed without a clear relationship to deliverables, contracts, and responsibilities.
Measuring consumed hours as physical progress
Effort consumption can increase even when the deliverable does not advance or requires rework.
Using equal weight for different items
Documents, equipment, or activities with different complexities contribute in an artificially equivalent way.
Confusing spending, billing, and progress
Each variable represents a different phenomenon and may have different recognition dates.
Mixing data dates
Planned, actual, and cost values do not represent the same time reference.
Replanning to hide delay
The baseline is changed without a formal decision and history disappears.
Presenting forecast as actual
The future projection is incorporated into the same line as validated progress.
Interpreting vertical difference as delay in days
The conversion ignores critical path, slope, and package distribution.
Analyzing only the overall curve
Variances between packages may offset one another and hide critical areas.
Ignoring quality and acceptance
Rejected or incomplete production is recognized as progress.
Using the S shape as an objective
The plan is manipulated to produce the visually expected curve instead of representing the actual strategy.
Producing a chart without a decision-making routine
The report communicates the variance but does not define an owner, action, deadline, or escalation.
How can the S-Curve be used in Owner’s Engineering?
In Owner’s Engineering, the curve can be used to independently verify:
- consistency of contractor baselines;
- weight structures and progress criteria;
- alignment between progress and evidence;
- compatibility between contracts;
- forecast quality;
- effects of changes and risks;
- sustainability of recovery plans;
- consistency between physical progress and financial measurement;
- readiness for gates, commissioning, and acceptance.
Owner’s Engineering should not accept the curve as self-explanatory information. The team must review the basis, challenge assumptions, and relate performance to the owner’s objectives.
The owner needs an independent reading of progress. Validating weights, criteria, evidence, forecast, and recovery plans reduces exclusive dependence on reports produced by the contractors responsible for execution.
When should specialized support be engaged?
Planning and control support is especially relevant when:
- there are multiple contractors and schedules;
- the WBS is not common across schedule, cost, and contracts;
- measurements are disputed;
- percentages lack clear evidence;
- the project has lost predictability;
- baselines have been changed repeatedly;
- cost and progress show divergent behaviors;
- an independent forecast is required;
- critical milestones are threatened;
- the client needs to structure corporate standards;
- the project requires executive reporting;
- there is a need to build technical records and benchmarking.
| Support model | Application | Typical deliverables |
| diagnostic | assess curve and control quality | assessment, gaps, and recommendations |
| initial structuring | create baseline, criteria, and governance | WBS, weights, calendar, templates, and flows |
| ongoing operation | maintain measurement and analysis cycles | updates, validation, forecast, and reports |
| independent audit | review contractor information | technical opinion on baseline, progress, and projection |
| project recovery | reassess plan and capacity | diagnostic, scenarios, and recovery plan |
| PMO support | standardize multiple projects | methodology, consolidation, and benchmarking |
| Owner’s Engineering support | defend the owner’s interests | validation, critical analysis, and recommendation |
Engineering Project Management can support control structuring and operation. Project Management integrates analysis with project decisions and actions.
How should the responsible company or team be evaluated?
Engagement should not be limited to proficiency with a spreadsheet or planning software. It is important to evaluate:
- experience in comparable projects;
- command of WBS, schedule, costs, risks, and contracts;
- progress-measurement methodology;
- ability to review weights and criteria;
- experience in consulting engineering and construction;
- independence from contractors;
- quality of forecast and analyses;
- data governance and cutoff calendar;
- ability to integrate systems and sources;
- technical record and benchmarking;
- clarity of deliverables and service levels;
- ability to explain decisions, not merely produce charts.
The proposal must define scope, team, dedication, tools, data sources, frequency, responsibilities, deliverables, assumptions, exclusions, and acceptance criteria.
How does technology support the S-Curve?
Planning tools, ERP, cost systems, document management, workflows, and analytics platforms can feed the curve. The ENGiOS platform integrates projects, contracts, documents, actions, risks, and indicators into a governance trail for engineering companies.
The architecture must define which system is authoritative for each object. The schedule may reside in a planning tool, costs in an ERP, and documents in a document-management system. Consolidation must preserve origin, version, data date, and owner.
Automation reduces manual collection but does not replace progress criteria, critical analysis, and management decision-making.
Conclusion
The S-Curve is a powerful visualization for monitoring the cumulative evolution of engineering projects, but its reliability depends on the structure behind the chart.
Organized scope, logic-driven schedule, progress criteria, coherent weights, an approved baseline, cutoff calendar, and data governance are essential conditions. Without them, the curve may create a perception of control that does not correspond to reality.
When integrated with Project Controls, the S-Curve makes it possible to compare plan, actual, and forecast, identify trend changes, and direct analyses. Pareto, Ishikawa, risk matrix, PDCA, 5W2H, and KPIs help turn the visual variance into diagnosis, decision, action, and effectiveness verification.
The instrument creates value when the organization can answer: what was the approved trajectory, where is the project now, why did it deviate, where is it likely to end up, and what needs to be decided now.
Technical references
[1] INTERNATIONAL ORGANIZATION FOR STANDARDIZATION. ISO 21502:2020 — Project, programme and portfolio management — Guidance on project management. Geneva: ISO, 2020. Available at: https://www.iso.org/standard/74947.html
[2] INTERNATIONAL ORGANIZATION FOR STANDARDIZATION. ISO 21511:2018 — Work breakdown structures for project and programme management. Geneva: ISO, 2018. Available at: https://www.iso.org/standard/69702.html
[3] INTERNATIONAL ORGANIZATION FOR STANDARDIZATION. ISO 21512:2024 — Project, programme and portfolio management — Earned value management implementation guidance. Geneva: ISO, 2024. Available at: https://www.iso.org/standard/63584.html
[4] AACE INTERNATIONAL. Total Cost Management Framework: An Integrated Approach to Portfolio, Program, and Project Management. 2nd ed. Morgantown: AACE International, 2019. Available at: https://web.aacei.org/resources/tcm
[5] PROJECT MANAGEMENT INSTITUTE. Practice Standard for Scheduling. 3rd ed. Newtown Square: Project Management Institute, 2019. Available at: https://www.pmi.org/standards/scheduling-third-edition
[6] PROJECT MANAGEMENT INSTITUTE. The Standard for Earned Value Management. Newtown Square: Project Management Institute, 2019. Available at: https://www.pmi.org/shop/p-/book/the-standard-for-earned-value-management/00101618501
[7] BRASIL. Law No. 14.133, of April 1, 2021. Public Procurement and Administrative Contracts Law. Available at: https://www.planalto.gov.br/ccivil_03/_ato2019-2022/2021/lei/l14133.htm
Frequently asked questions
It is a chart of cumulative values over time used to compare planned, actual, and forecast evolution of progress, costs, hours, quantities, or cash outflows.
Many projects start slowly, accelerate during peak production, and decelerate during closeout. However, the shape is not mandatory and must represent the project’s actual strategy.
Not directly. The distance between curves indicates cumulative variance, but delay in days depends on the schedule, critical path, float, and affected packages.
The physical curve represents work performed according to progress criteria. The financial curve may represent budget, costs, commitments, billing, or cash outflow.
Weights may consider cost, hours, quantities, milestones, or technical value. The method must be documented, consistent with the project, and approved before measurement.
No. The S-Curve is a cumulative visualization. Earned Value Management uses specific concepts to integrate scope, schedule, and cost and may be represented using curves.
Yes. Technical deliverables can be weighted and measured using verifiable milestones such as development, review, submission, approval, and final issue.
When there are multiple contracts, divergent criteria, disputed measurements, loss of predictability, a need for independent forecasting, or a requirement to structure Project Controls.
Complementary technical materials
1. Planning fundamentals and control structure
- Complete guide to project management
- PMBOK and project management
- PMO: types, functions, and structuring
- WBS in engineering projects
- RACI Matrix in engineering projects
2. Performance measurement, risk, and prioritization
- Risk Matrix in engineering projects
- Project prioritization matrix
- KPIs and performance indicators
- Pareto Diagram in project management
3. Diagnostics, actions, and effectiveness control
- Ishikawa Diagram and root cause analysis
- PDCA applied to continuous improvement
- 5W2H applied to action plans
- Workflow and approval flows
- Contract management in engineering
- Acceptance criteria in engineering
4. Solutions for governance and control integration
- Project, Program, and Portfolio Governance
- Engineering PMO Implementation and Structuring
- Indicators, Dashboards, and Executive Reports
- Contract, Scope, and Deliverable Management
- Process, Workflow, and Technical Approval Management
5. Platform, management, and owner representation
- ENGiOS — Management Platform for Engineering Companies
- Project Management
- Engineering Project Management
- Owner’s Engineering
- Ongoing Consulting Engineering Services
6. Technical sources and official references