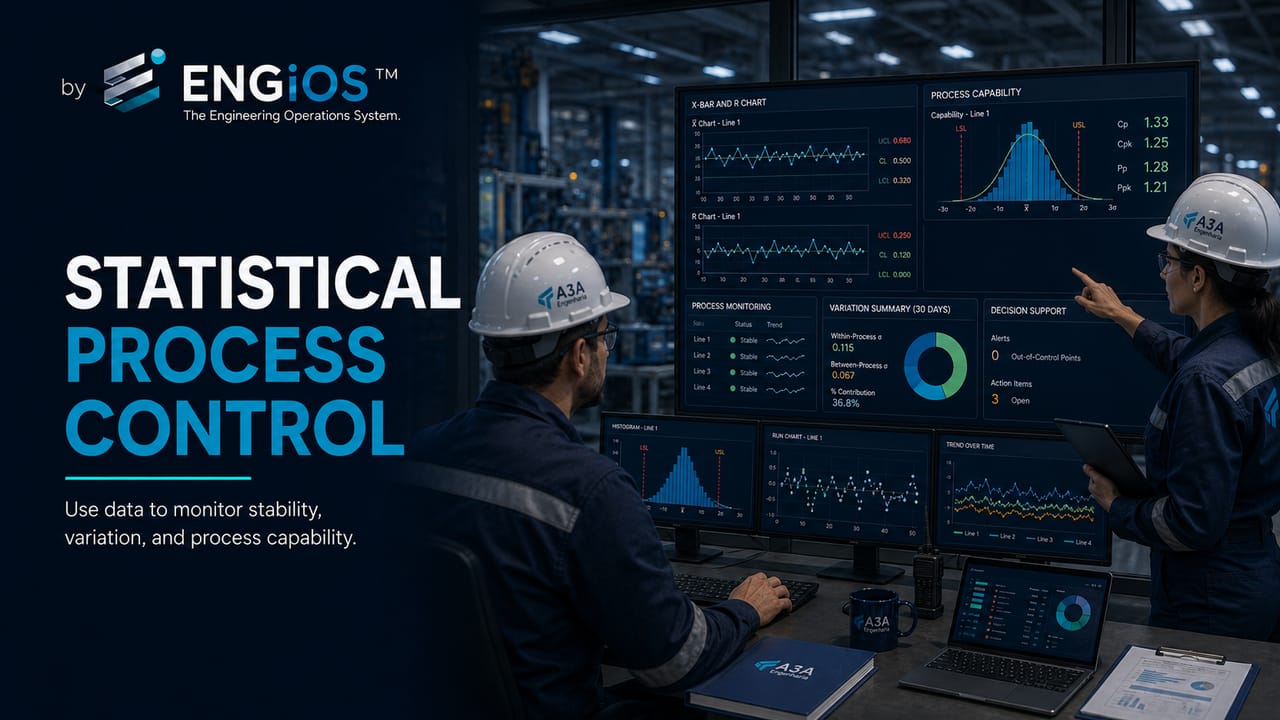
Understand Statistical Process Control (SPC), common and special causes, stability, control limits, capability, and Engineering applications.
Check it out!
Statistical Process Control — SPC — is a monitoring and analysis approach that uses data over time to understand process variation and identify signals of change that justify investigation. Its purpose is not merely to verify whether a result is within specification, but to distinguish routine process behavior from evidence that a different condition has begun to act.
In Engineering, SPC is useful whenever there is a repetitive characteristic that can be measured consistently: dimensions, torque, pressure, temperature, resistance, cycle time, defect rate, number of occurrences per period, performance of a testing process, or another suitable variable. The central concept is simple: every process varies, but not every variation means there is a problem. Management improves when the team can separate common variation, inherent to the system, from special signals associated with specific changes.
SPC is not synonymous with a control chart. Control charts are one of the main SPC tools, but the system includes operational definition, data collection, stratification, process understanding, stability, cause investigation, capability, and a reaction plan. It is also not the same as final inspection: while inspection checks units or lots, SPC seeks to understand the behavior of the process that generates the results.
What Is Statistical Process Control — SPC?
SPC is a set of statistical principles and techniques used to monitor processes, detect relevant changes, and support control and improvement actions. NIST describes Statistical Process Control as an approach based on comparing what is happening now with previously observed behavior, using expected limits to signal when the process may have degraded or changed.
In a stable process, individual results still vary. The existence of dispersion does not necessarily mean a new cause has appeared. This distinction is critical because two management errors are common:
- reacting to every fluctuation as if it were an anomaly, increasing variability even further;
- ignoring real signals of change because “variation is normal.”
SPC creates a method for deciding when variation deserves investigation.
Why Does Every Process Vary?
No real process produces absolutely identical results. Differences may arise from material, equipment, environment, method, measurement, operators, software, sequence, load, supplier, and countless interactions.
The relevant question is not “is there variation?”, but what pattern of variation exists, and does the process remain predictable within that pattern?
A set of torque measurements may vary around a mean. Approval times may fluctuate from one case to another. Test results may show dispersion. If this variation remains consistent over time, the process may be stable even if its mean or capability still needs improvement.
Common and Special Causes of Variation
The classical language of statistical control distinguishes common causes and special causes.
Common causes
These are sources of variation embedded in the system as it normally operates. They reflect the combined effect of method, design, resources, measurement, environment, and other routine conditions.
If the process is stable but shows excessive dispersion, focusing on individual operators may not solve the problem. Improvement requires changing the system itself.
Special causes
These are specific conditions that alter behavior: a degraded tool, different raw material, incorrect configuration, measurement error, shift change, equipment failure, updated software, exceptional procedure, or another identifiable change.
A special cause does not have to be “bad.” A successfully implemented improvement can also produce a statistically detectable change.
| Type of variation | Nature | Typical management response |
| common | inherent to the current system | improve the process, method, or design |
| special | specific change or anomaly | identify and address the condition |
This distinction changes the management approach. A common cause calls for systemic action; a special cause calls for investigation of the event or change.
What Does a Stable Process Mean?
Stability means that the process shows a sufficiently consistent pattern of variation to be considered predictable under the observed conditions. It does not mean the process is good, capable, or conforming.
A process can be stable and still produce 8% defects. In that case, the problem is not an occasional anomaly: the system is consistently delivering inadequate performance.
The opposite is also possible. A process may temporarily produce results within specification while showing signals of change that indicate instability.
For that reason, SPC separates two questions:
- is the process stable?
- if it is stable, is it capable of meeting the requirements?
Mixing these questions leads to incorrect decisions.
Process Stability vs. Capability
Capability compares the process distribution with specification limits. NIST defines capability analysis as a comparison between process performance and specifications, often expressed through indices such as Cp and Cpk when the assumptions are appropriate.
Stability comes first because a changing process does not have a single predictable distribution that can be compared straightforwardly with the specification.
| Situation | Interpretation |
| stable and capable | predictable process compatible with the specification |
| stable and incapable | the system needs structural improvement |
| unstable and apparently capable | current performance may not be sustainable |
| unstable and incapable | first investigate special causes, then assess capability |
The purpose is not to turn these quadrants into rigid labels, but to organize the reasoning.
Control Limits vs. Specification Limits
This is one of the most important distinctions in SPC.
Specification limits come from requirements external to the statistical behavior: design, standard, contract, customer, functional tolerance, or acceptance criterion.
Control limits are calculated from process behavior and help identify signals incompatible with the variation expected under stability.
A process may have control limits entirely within the specifications and be capable. Its limits may be wider than the specification and the process incapable. It may also be unstable, making the assessment more complex.
Never replace a specification with a control limit. The fact that a measurement is “in control” does not mean it conforms to the requirement.
SPC vs. Quality Control — QC
Quality Control — QC is a broader concept that includes inspections, tests, measurements, acceptance criteria, and conformity verification.
SPC is a specific approach within the control and improvement domain: it analyzes process behavior over time.
QC may answer “does this item comply?” SPC seeks to answer “is the process that produces these items stable, and how is it varying?”
The two perspectives complement each other. QC data feeds SPC; SPC signals help direct inspections and improvements.
SPC vs. Sampling Inspection
NIST distinguishes Statistical Process Control from Statistical Quality Control based on lot sampling. Sampling inspection seeks to assess the quality of a lot without measuring 100% of the units. SPC follows the process and change over time.
A company may use both. Incoming materials may use a sampling plan; the manufacturer may use SPC in production; technical inspection may still require acceptance tests.
SPC vs. KPI Monitoring
A KPI dashboard shows performance but does not necessarily apply statistical stability logic.
A monthly rework line may show a visual trend. A control chart adds a center line, limits, and rules for interpreting signals.
Not every KPI deserves SPC. The technique requires a coherent sequence, adequate frequency, an operational definition, and a sufficiently repetitive process.
What Are the Components of an SPC System?
Effective SPC includes more than a chart.
The sequence shows that the chart sits in the middle of the analytical process, not at the beginning.
1. Define the Characteristic That Matters
An organization may measure hundreds of variables. SPC should be applied where stability has decision value.
Useful criteria include:
- relationship to a critical requirement;
- impact on safety or performance;
- recurrence;
- cost of failure;
- ability to measure repeatedly;
- sensitivity to process changes;
- preventive value of the signal.
Applying SPC to everything creates management noise and system maintenance cost.
2. Build an Operational Definition
Before collecting data, define exactly what each observation means.
For “review cycle time,” for example:
- start: issue date or workflow entry date?
- end: first decision or final approval?
- are returns included in the same cycle?
- are external waiting periods counted?
- are the units elapsed hours or business days?
Without this definition, measured variation may reflect recording differences rather than process behavior.
3. Assess the Measurement System
For physical variables, uncertainty, resolution, calibration, repeatability, and reproducibility may be relevant. For administrative data, system integrity, timestamps, taxonomy, and recording discipline play an equivalent role.
If the instrument or measurement rule generates significant variation, the chart may signal the measurement system rather than the process.
4. Understand Subgroups and Time Sequence
Control charts depend on data order. In many types, subgroup formation is also central.
The concept of a rational subgroup seeks to group observations produced under comparable conditions, allowing within-subgroup variation to represent the short term and differences between subgroups to reveal changes over time.
In physical production, the subgroup may be a sample taken every hour. In a testing process, it may be a set per lot. In administrative Engineering data, the application must be designed carefully because cases may vary greatly in complexity.
5. Stratify Before Drawing Conclusions
Mixing different populations can produce a misleading chart.
Before applying SPC, verify that the data belong to the same process and context. It may be necessary to separate by:
- equipment;
- line;
- supplier;
- material;
- shift;
- discipline;
- document type;
- complexity;
- stage;
- test method;
- location.
If three suppliers have different means, an aggregated chart may hide changes within each supplier or simulate instability caused only by the mix.
Control Charts Within SPC
Control charts are time-series graphs with a center line and statistical limits. Different families exist depending on data type, subgroup size, and objective.
This article treats the chart as a component of the SPC system. The dedicated article on Control Charts in Engineering goes deeper into selection, construction, and interpretation without duplicating the role of SPC as a management approach.
In general, there are charts for:
- continuous variables;
- proportion or number of nonconforming units;
- defect counts;
- individual observations;
- small accumulated shifts, such as CUSUM;
- weighted moving averages, such as EWMA;
- multivariate situations.
The wrong choice can produce inappropriate limits or invalid interpretation.
Shewhart Chart
Classical Shewhart charts are widely used to detect relatively significant changes in process level or variability.
The general idea is to plot a statistic over time, a center line, and control limits. Points or patterns incompatible with stability generate a signal for investigation.
Important: being within the limits does not mean “there is nothing to do.” Sequence patterns may also indicate a change, depending on the rules adopted.
CUSUM and EWMA
CUSUM accumulates deviations from a reference value and can be more sensitive to small persistent shifts. EWMA assigns decreasing weights to past observations and can also detect smaller shifts.
These techniques require greater care in configuration and interpretation. They should not be chosen simply because they appear more sophisticated.
What Data Can Be Used in SPC?
Selection depends on the nature of the variable.
Variable data
These are continuous or approximately continuous numerical measurements: dimension, temperature, pressure, resistance, voltage, mass, time.
Attribute data
These represent classification or counting: conforming/nonconforming, number of defects, number of occurrences.
The distinction affects the appropriate chart and statistical assumptions.
SPC in Manufacturing and Assembly Engineering
Typical applications include:
- critical dimensions;
- tightening torque;
- coating thickness;
- test pressure;
- electrical resistance;
- process temperature;
- concentricity;
- mass;
- welding parameters;
- repetitive test results.
SPC can signal tool degradation, lot changes, incorrect setup, or a trend before a large volume of nonconformity appears.
SPC only creates value when measurement is linked to a critical characteristic and a reaction plan. Charts without an owner, decision criterion, and special-cause investigation do not constitute process control.
Structure criteria and controls with Technical Engineering Consulting →
SPC in Inspections and Commissioning
Not every inspection is suitable for SPC, especially when each item is unique. But repetitive testing processes may produce useful series.
Examples include:
- time to close punch items of the same class;
- rejection rate by lot or period;
- repetitive test results on homogeneous equipment;
- number of defects per comparable unit;
- parameters measured in a commissioning sequence.
The point is to preserve comparability. Mixing systems with different complexity and requirements can produce a statistical conclusion with no technical meaning.
SPC in Engineering Document Processes
Administrative applications require even greater care, but they can create value when the process is repetitive.
Possible variables include:
- analysis time for documents of the same class;
- first-issue approval rate;
- number of comments per document, stratified by type;
- percentage of returns due to missing requirements;
- backlog by period;
- response time to RFIs of a comparable class.
Before using a control chart, verify that the complexity mix is sufficiently homogeneous. A highly complex technical report and a simple datasheet should not necessarily share the same time distribution.
SPC in Maintenance and Reliability
SPC can support monitoring of condition and performance parameters when a repetitive series exists: vibration, temperature, consumption, repair time, or process characteristics.
However, condition monitoring has specific techniques, physical trends, and alarm limits that should not be mechanically replaced by statistical limits.
Engineering knowledge remains paramount. A safety limit defined by the manufacturer or a standard cannot be ignored because the statistical chart has not yet signaled a change.
SPC in Supplier Management
Suppliers can be assessed for stability of critical characteristics, not only by mean or aggregate rejection rate.
A supplier with an acceptable mean but an unstable process represents risk. Another may be stable but shifted from target and require process adjustment.
In technical procurement, SPC data can support qualification, supplier development, and inspection plans, provided contractual criteria and responsibilities are clear.
How to Investigate a Special-Cause Signal
A signal is an invitation to investigate, not an automatic conclusion.
The sequence may be:
- Confirm that the data and measurement are correct.
- Check whether a known change occurred during the period.
- Examine material, equipment, method, environment, and people.
- Stratify data by context.
- Compare with logs, maintenance, revision, lot, or events.
- Formulate hypotheses.
- Test the hypothesis against evidence.
- Address the cause when validated.
- Record the event and monitor the return to stability.
Tools such as 5 Whys and the Ishikawa Diagram can support investigation, but they do not replace technical evidence.
What If Variation Is Common but Performance Is Poor?
This scenario calls for system improvement.
If the chart indicates stability and the process still generates excessive rework, the problem is not an isolated event. Adjusting one operator or shift may produce little change.
The organization needs to review method, design, capacity, equipment, requirements, standard work, training, suppliers, or another structural dimension.
This is a connection point between SPC and DMAIC: SPC demonstrates behavior; an improvement method structures the change to the system.
Tampering: When Overreacting Makes the Process Worse
A classic risk in controlled processes is adjusting the system after every small fluctuation, even when it belongs to common variation.
Imagine an operator correcting the setpoint after every individual measurement. If the measurement naturally fluctuates around the target, successive adjustments can increase total variability.
The same phenomenon exists in administrative processes: changing priorities daily because of small fluctuations in backlog can disrupt capacity and increase cycle time.
SPC helps define when there is sufficient evidence for intervention.
SPC and Continuous Improvement
SPC is not merely an inspection tool. It can show whether an improvement produced a change and whether the new state remains stable.
A typical sequence is:
- establish a baseline;
- identify signals and sources of variation;
- improve structural causes;
- recalculate reference behavior once the new process has stabilized;
- monitor the new pattern;
- react to deviations according to the defined plan.
This integrates with PDCA and DMAIC.
SPC in the Measure Phase of DMAIC
Measure uses SPC to characterize the current state when appropriate. The team observes stability, dispersion, and baseline.
If the process already shows special signals, it may be necessary to investigate these conditions before estimating capability.
SPC in the Analyze Phase
Time-based signals help associate changes with events, lots, shifts, suppliers, revisions, or method changes.
The chart does not prove the cause, but it identifies when the change occurred and helps narrow the investigation window.
SPC in the Control Phase
After improvement, SPC can monitor the stability of the new process and trigger the reaction plan.
This is an especially important application: ensuring that the gain does not silently disappear.
When the process is stable but still delivers poor performance, the problem is systemic. Under this condition, hunting isolated anomalies tends to consume effort without changing the actual capability of the process.
How to Establish a Reliable Baseline
The baseline should represent a understood process condition. Do not automatically use “the last 12 months” if important changes occurred during the period.
Check for:
- equipment modifications;
- supplier changes;
- method changes;
- software updates;
- team changes;
- product or mix changes;
- calibration or a new instrument;
- specification changes;
- shutdowns and restarts.
A baseline that mixes different regimes can generate artificial limits.
How Much Data Is Needed?
There is no universal number for every SPC application. The amount depends on the chart, frequency, variability, subgroups, and objective.
The mistake is choosing an arbitrary sample size without considering representativeness. Too little data can produce unstable limits; large amounts of historical data from different regimes can also be inappropriate.
Implementation should follow statistical guidance specific to the selected chart and knowledge of the process.
What Are Out-of-Control Signals?
The best-known signal is a point beyond a control limit. But control rules may also consider runs, trends, clustering, and other patterns.
Interpretation depends on the chart and the rule set adopted. Overly sensitive rules increase false alarms; insufficiently sensitive rules can delay detection.
For that reason, the specific article on control charts should address this subject in greater detail. At the SPC level, the principle is: a statistical signal triggers proportionate investigation, not automatic action without diagnosis.
How to Build a Reaction Plan
Without a reaction plan, the chart can become wall decoration or just another dashboard.
A plan should answer:
| Question | Example |
| Which signal requires a reaction? | point beyond a limit or a defined pattern |
| Who receives the alert? | process leader |
| What should be checked first? | measurement, lot, setup, recent change |
| Does the process need to stop? | according to criticality and requirement |
| Who investigates the cause? | Engineering + Quality + operations |
| How is it recorded? | NCR, occurrence record, or SPC log |
| How is it closed? | cause, action, and evidence of return to stability |
The severity of the response should consider technical risk and conformity requirements. A signal involving a safety characteristic cannot wait for the same routine as an administrative indicator.
SPC and the Control Plan
A control plan connects the characteristic, measurement method, frequency, responsible person, specification limit, statistical method, and reaction.
It should remain aligned with the actual process. Changes in equipment, product, supplier, or method may require revision.
Control should not depend exclusively on experts’ memory.
SPC and Capability Analysis
After establishing stability, the team can assess capability against the specification.
NIST presents Cp as the ratio between specification width and process dispersion in a classical formulation. Cpk incorporates the shift relative to the limits.
These indices require an understanding of assumptions. Nonnormal distributions, autocorrelation, insufficient samples, or mixed populations require suitable methods.
A number such as “Cpk 1.33” should not be interpreted outside the context of the characteristic, period, stability, and method.
SPC and Autocorrelation
Many Engineering processes and time-series data exhibit autocorrelation: one observation depends on previous observations. This can violate assumptions of classical charts and artificially narrow the limits.
Continuous processes, sensors, and aggregated metrics may require specific modeling. If the team does not master the assumptions, it is preferable to seek statistical support rather than automatically apply a standard chart.
SPC and Rare Data
Low-frequency events may require long windows or specific techniques. A monthly chart of rare incidents may have little sensitivity.
The method must be proportional to the phenomenon. In some cases, reliability analysis, risk analysis, or time-between-events analysis is more appropriate.
Main Errors in Statistical Process Control
Confusing control with conformity
A stable process may still be incapable. A control limit is not a specification limit.
Calculating limits with data from mixed regimes
Process changes within the baseline can inflate limits and hide signals.
Applying the wrong chart to the data type
Continuous variables and counts have different distributions and charts.
Ignoring the measurement system
Instrument variation may be confused with process variation.
Reacting to every point
Excessive adjustment can increase dispersion.
Ignoring signals because the product still conforms
Instability can anticipate future deterioration.
Using SPC where there is insufficient repeatability
Unique or highly heterogeneous processes may not produce a comparable series.
Having a chart without an owner and reaction plan
A signal without assigned responsibility does not create control.
A control chart without a reaction plan merely records the problem. For SPC to work as a management system, each signal needs an owner, a verification sequence, an escalation criterion, and evidence of closure.
How to Implement SPC Pragmatically
An implementation can start small.
- Choose a critical, repetitive characteristic.
- Clearly define the process and measurement.
- Collect data in time sequence.
- Check context changes and stratify.
- Choose a chart appropriate to the data type.
- Establish a baseline and limits using a defensible method.
- Define signal rules and a reaction plan.
- Train those who interpret and react.
- Investigate special causes and record learning.
- Assess capability when the process is stable.
- Review the system after relevant changes.
The initial objective should not be to create dozens of charts. It should be to demonstrate that the organization can transform a signal into the correct decision.
When to Seek Specialized Support
Statistical or consulting support is advisable when:
- the characteristic is critical;
- multiple populations exist;
- the data are autocorrelated;
- chart selection is uncertain;
- capability indices affect a contract or acceptance;
- there is a large volume of data;
- the organization needs to integrate SPC with QA/QC or suppliers;
- signals appear without a clear cause;
- the administrative process is highly heterogeneous;
- the measurement system is complex.
Engineering Consulting can combine process knowledge with quantitative analysis, preventing statistics from being applied without technical context.
SPC and Engineering Consulting
In consulting, the objective of SPC is not to deliver charts, but to build decision capability. This involves defining critical characteristics, validating data, separating populations, selecting the technique, interpreting signals, and integrating the result into governance and corrective action.
For operational or Engineering processes, Engineering Process Diagnosis and Optimization can identify where variation is being created and which indicators should be controlled.
For specific technical issues, Technical Engineering Consulting can support interpretation of causes, requirements, and intervention decisions.
Final Considerations
Statistical Process Control turns variation into management information. The fundamental principle is to distinguish expected process behavior from signals that indicate change. This distinction avoids both overreaction and complacency in the face of anomalies.
SPC is not just a control chart and it is not final inspection. It starts with defining the characteristic and the measurement system, proceeds through stability and investigation, connects to capability, and ends with a reaction plan capable of sustaining the process.
In Engineering, the application can cover manufacturing, assembly, testing, QA/QC, suppliers, maintenance, and even repetitive document processes. The requirement is the same: comparable data, appropriate statistical interpretation, and sufficient technical knowledge to turn a signal into proportionate action.
Technical references
[1] NATIONAL INSTITUTE OF STANDARDS AND TECHNOLOGY. NIST/SEMATECH Engineering Statistics Handbook — Process or Product Monitoring and Control. Available at: https://www.nist.gov/publications/nistsematech-engineering-statistics-handbook-chapter-6-process-or-product-monitoring
[2] NATIONAL INSTITUTE OF STANDARDS AND TECHNOLOGY. What are Process Control Techniques? Available at: https://www.itl.nist.gov/div898/handbook/pmc/section1/pmc12.htm
[3] NATIONAL INSTITUTE OF STANDARDS AND TECHNOLOGY. What are Control Charts? Available at: https://www.itl.nist.gov/div898/handbook/pmc/section3/pmc31.htm
[4] NATIONAL INSTITUTE OF STANDARDS AND TECHNOLOGY. Assessing Process Capability. Available at: https://www.itl.nist.gov/div898/handbook/ppc/section4/ppc46.htm
[5] AMERICAN SOCIETY FOR QUALITY. Seven Basic Quality Tools. Available at: https://asq.org/quality-resources/seven-basic-quality-tools
Frequently asked questions
It is a monitoring and analysis approach that uses data over time to understand process variation, identify signals of change, and support control and improvement actions.
Yes. CEP is the Portuguese acronym for Controle Estatístico de Processo; SPC is the English acronym for Statistical Process Control.
No. A control chart is one of the main SPC tools. The system also involves process definition, measurement, stratification, stability, investigation, capability, and a reaction plan.
Control limits are derived from the statistical behavior of the process. Specification limits come from design, standard, contract, or customer requirements.
No. It may be stable and predictable while having a mean or dispersion incompatible with the specification. Capability must be assessed separately.
Common causes belong to the normal process system. Special causes are specific conditions or changes that alter the pattern of behavior and justify investigation.
Yes, provided there is sufficient repeatability, operational definition, and comparability. Cycle times, approvals, and defect rates can be analyzed carefully.
When there is no comparable sequence, the data mix very different populations, measurement is unreliable, or the selected statistical technique does not match the phenomenon.