Technical guide to network troubleshooting: layered diagnosis, cabling, PoE, switching, VLANs, DHCP, DNS, firewall, Wi-Fi, WAN, root cause, and correction.
Check it out!
Network troubleshooting is the structured process of identifying, isolating, and correcting connectivity, availability, or performance failures based on evidence. The objective is not to test commands randomly or replace equipment by trial and error. It is to narrow the failure domain, formulate hypotheses, measure network behavior, and prove the root cause before applying a correction.
A failure perceived as “the network is slow” may originate in cabling, a switch port, PoE, a saturated uplink, Wi-Fi, a VLAN, routing, DNS, DHCP, the firewall, the WAN link, a server, or the application. Efficient troubleshooting therefore separates symptom, cause, and impact and examines the communication chain systematically.
What Is Network Troubleshooting?
Troubleshooting is a technical diagnostic activity. In small networks, many incidents can be resolved by an internal team using basic tools. In corporate, industrial, or critical environments, however, the number of layers, vendors, dependencies, and paths makes it necessary to work with topology, documentation, metrics, logs, and test instruments.
The difference between a point correction and an engineering diagnosis lies in traceability. A point correction may restore service; an engineering diagnosis must explain what failed, why it failed, how it was proven, what correction was applied, and how recurrence can be prevented.
A Symptom Is Not the Root Cause
Users describe effects: slowness, outages, frozen video, phones without audio, offline cameras, pages that do not open, failed authentication. These reports are important, but they do not yet locate the problem.
Some examples illustrate the difference:
| Symptom | Possible causes |
| workstation without access | cable, port, VLAN, DHCP, authentication, gateway, DNS |
| AP rebooting | PoE, switch power supply, cable, firmware, temperature |
| unstable videoconference | Wi-Fi, uplink, loss, jitter, WAN, firewall, application |
| intermittent camera | physical channel, PoE, switch, uplink, VMS, power |
| slow transfer | negotiation, interface errors, saturation, storage, server |
| multiple areas offline | switch, uplink, core, power, routing, shared service |
Replacing a patch cord may resolve a symptom, but if the defect is a marginal termination in the permanent link, the failure is likely to return.
First Step: Define the Failure Domain
Diagnosis begins by defining the scope of the problem.
Simple questions dramatically narrow the field of investigation:
- does it affect one user, one room, one switch, one floor, or the entire organization?
- does it affect wired and wireless users or only one medium?
- does it affect all services or only one application?
- did it begin after a change?
- does it occur continuously or at specific times?
- does it coincide with utilization peaks?
- is there a correlation with power, temperature, or infrastructure events?
- do all affected devices share a switch, uplink, VLAN, gateway, or service?
When several failures share a common element, that element becomes a priority candidate. This reasoning prevents starting the analysis at the most visible but technically unlikely point.
Collect Evidence Before Making Changes
Changing configuration during diagnosis can destroy the evidence needed to locate the cause. Before rebooting a switch, changing a route, moving a VLAN, or replacing equipment, record the current state.
Depending on the incident, evidence collection may include:
- start time and duration;
- affected users and systems;
- path topology;
- interface status and speed;
- error and drop counters;
- CPU and memory utilization;
- uplink utilization;
- system logs;
- spanning-tree and LACP events;
- PoE status;
- DHCP leases;
- DNS queries and responses;
- latency and loss across different hops;
- Wi-Fi signal power and quality;
- firewall and WAN-link alerts;
- recent changes.
A snapshot of the pre-incident state also helps compare normal and abnormal behavior.
Baseline: Know What Normal Looks Like
Without a baseline, “it is slow” becomes a subjective comparison. A baseline records typical conditions so that deviations can be measured.
It may include:
- typical uplink utilization;
- internal latency between segments;
- packet loss under normal conditions;
- interface errors;
- equipment availability;
- used and available PoE power;
- clients and airtime per AP;
- consumption by application or system;
- failover events;
- recurring incidents.
After correction, the same metrics help demonstrate the result. A baseline also makes it possible to detect gradual degradation before it becomes an outage.
Layered Troubleshooting Avoids Hypothesis Jumps
A layered approach does not mean rigidly following the OSI model from Layer 1 through Layer 7 in every case. It means testing hypotheses that are consistent with the symptom first while remaining clear about which layer is being investigated.
In corporate networks, a practical sequence usually separates:
- power and physical media;
- Ethernet interface and switching;
- VLANs and Layer 2;
- addressing and Layer 3;
- services such as DHCP, DNS, and authentication;
- security and policies;
- WAN, servers, and applications;
- Wi-Fi, when access is wireless.
The key is not to conclude that “the cable is bad” because there is loss, or that “the firewall blocked it” because a port does not respond, without corresponding evidence.
Physical Layer: The Problem Can Exist Before IP
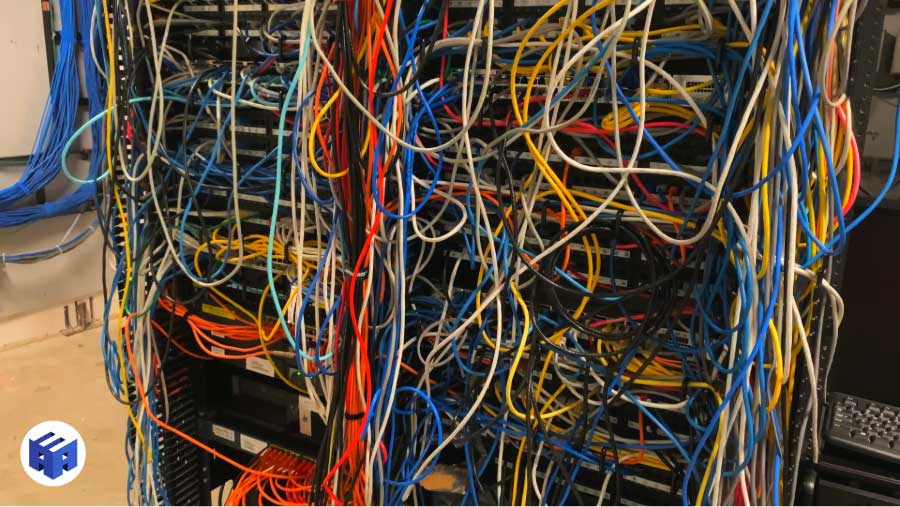
The physical layer includes cables, connectors, patch panels, patch cords, fibers, fiber distribution frames, interfaces, transceivers, power, racks, and pathways.
Physical failures can produce intermittent symptoms that are difficult to reproduce. A link can come up and still have insufficient margin, errors, renegotiation, or instability under certain conditions.
Signs that justify physical-layer investigation include:
- negotiated speed below expectations;
- link flapping;
- increasing CRC/FCS or other interface errors;
- failure concentrated at one point or set of points;
- behavior that changes after moving patch cords;
- problems associated with heat, humidity, vibration, or interference;
- unstable PoE;
- history of improvised terminations or uncontrolled expansion.
Continuity Is Not Certification
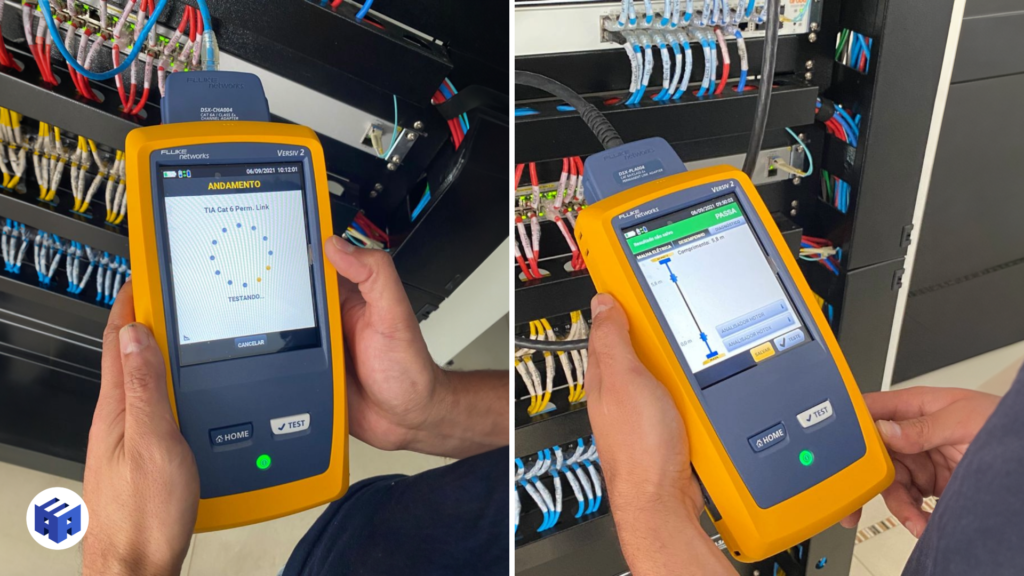
A simple continuity tester checks the basic conductor map and can locate circuits. This does not prove that a link meets the performance requirements of a category/class.
Copper-cabling certification uses an appropriate instrument and limits defined for the tested configuration, such as Permanent Link, Channel, or MPTL. Applicable parameters include insertion loss, NEXT, PSNEXT, return loss, length, and others specified by the selected test limit.
In troubleshooting, certification is useful when physical degradation, improper installation, or component changes are suspected, or when the organization lacks reliable evidence of link performance.
PASS/FAIL Does Not End the Diagnosis
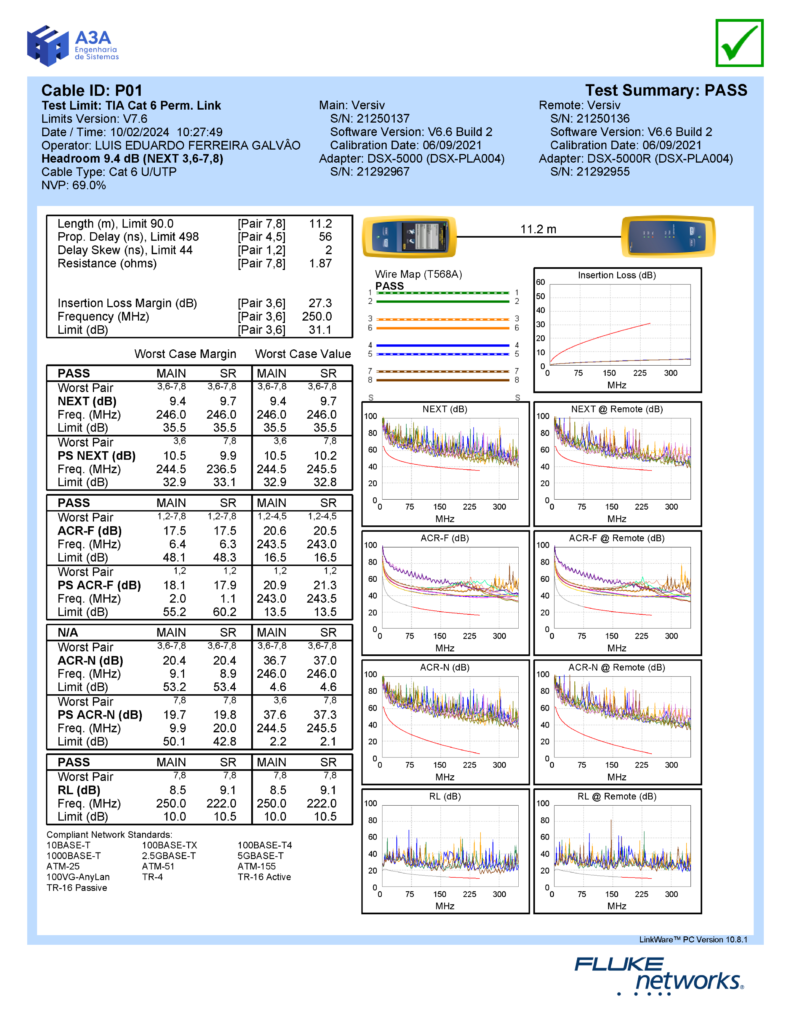
A PASS result indicates compliance with the selected limit at the time of the test. It does not prove that the entire logical network, switch, server, or application is correct.
Likewise, a FAIL result must be interpreted. The parameter and frequency at which the failure occurs help direct the investigation toward termination, length, component, connection, or installation condition.
Margin is also relevant in comparative diagnosis: passing links very close to the limit may deserve attention when there is a history of intermittency, although the intervention decision should consider the full body of evidence.
Optical Fiber: Visual Continuity Is Not Enough
In an optical backbone, troubleshooting may require connector inspection and cleaning, power/loss measurement, and OTDR where applicable.
OLTS/LSPM and OTDR answer different questions. Loss measurement evaluates end-to-end performance within the defined method; OTDR helps locate events along the link. One should not automatically be treated as a substitute for the other.
Before concluding that a transceiver is defective, verify cleanliness, connectivity, optical budget, compatibility, received power, and link condition.
PoE Adds an Electrical Dimension to Troubleshooting
When a device depends on Power over Ethernet, the data link and power supply share the same path. An AP or camera that reboots may be experiencing a power problem rather than a protocol problem.
The investigation should consider:
- required PoE standard and class;
- power requested by the device;
- power available per port;
- total switch power budget;
- power-supply redundancy;
- condition of cabling and connectors;
- channel length;
- overcurrent or protection events;
- rack temperature and ventilation.
Problems may appear only during power peaks, boot, feature activation, or after increasing the number of powered devices.
Ethernet Interface: Counters Tell the Story
A port that appears to be “up” can still indicate a problem.
Depending on the platform, observe:
- negotiated speed and duplex;
- receive and transmit errors;
- CRC/FCS;
- drops and discards;
- link flaps;
- utilization;
- pause frames where available;
- optical-module errors;
- transceiver temperature and alarms;
- PoE events.
Counters should be evaluated over a time window. A value accumulated over years is less useful than the rate of increase during the incident.
Negotiated Speed Below Expectations
A workstation expected to operate at 1 Gb/s but running at 100 Mb/s is a valuable clue. There may be a problem with pairs, termination, patch cord, configuration, or equipment capability.
Diagnosis should confirm:
- capability of both interfaces;
- negotiation configuration;
- physical-channel condition;
- patch cords and connectors;
- port errors;
- flap history.
Manually forcing speed without understanding the cause can hide the problem and create new incompatibilities.
Switching: VLAN, STP, and LACP
After verifying physical access, Layer 2 becomes a candidate.
VLANs
A port can have link and still fail to reach the destination if it is in the wrong VLAN, if the VLAN is not allowed on the trunk, or if tagging is inconsistent.
Compare the actual configuration with the architecture. Accumulated emergency changes are a common cause of divergence between documentation and production.
Spanning Tree
Layer 2 loops can cause storms, high utilization, and widespread instability. Topology events can also indicate flapping links or paths changing repeatedly.
Analysis should examine the expected topology, root bridge, blocked/forwarding ports, recent changes, and temporal correlation with the incident.
LACP and Aggregation
A port-channel can remain active even with a defective member or improper distribution. Verify member state, configuration consistency, hashes, errors, and the capacity actually available.
Uplinks and Oversubscription
Many problems described as “network slowness” are actually saturation at aggregation points.
Compare access capacity with uplinks and traffic behavior. Oversubscription is not necessarily an error; it is an engineering decision that must be consistent with concurrency and application profiles.
Diagnosis should examine peaks, averages, percentiles where available, queue drops, interface utilization, and complaint times.
IP Addressing and Gateway
If Layer 2 is functional, verify the IP configuration.
Basic questions:
- did the device receive the correct address?
- is the mask/prefix correct?
- does the gateway belong to the correct network?
- is there a duplicate IP?
- does a route to the destination exist?
- does the return traffic follow a compatible path?
Ping can demonstrate reachability, but by itself it does not determine application quality or automatically identify the cause of loss.
DHCP: Investigate the Entire Process
A client without an address may indicate DHCP-server unavailability, an incorrect relay, the wrong VLAN, an exhausted scope, a security policy, or a Layer 2 problem.
Troubleshooting should follow the chain from the client request through offer and lease, considering relay operation and service reachability.
Assigning a temporary static address can help isolate the hypothesis, but it is not a definitive correction for a DHCP problem.
DNS: Connectivity May Exist While the Service Appears Unavailable
When access by IP works but access by name does not, DNS becomes a candidate. Verify the configured server, response, resolution time, records, and path to the service.
Avoid indiscriminately replacing corporate DNS with a public server in production. Internal environments may depend on private zones, authentication, and policies that do not exist outside the organization.
Routing: Both Directions Matter
The existence of a forward route does not guarantee functional communication. Asymmetric paths, policies, VRFs, and specific routes can affect return traffic and firewall inspection.
Analyze the routing table, next hop, prefixes, metrics, and recent changes. Traceroute can help visualize part of the path, but ICMP responses may be filtered or prioritized differently from application traffic.
Firewall: Test Policy Without Dismantling Security
The old procedure of “temporarily disabling the firewall to test” is inappropriate in production environments. Diagnosis should use logs, sessions, counters, policies, and controlled packet capture.
Verify:
- source and destination;
- port/protocol;
- zone or interface;
- matched policy;
- NAT where applicable;
- session state;
- application inspection;
- authentication;
- deny/allow logs;
- return traffic.
Test changes should be planned, limited, and reversible.
Wi-Fi Requires RF and Wired-Network Diagnosis
A wireless problem may be in the radio, client, or AP uplink.
Diagnosis should separate:
- coverage;
- SNR;
- interference;
- channel utilization;
- airtime;
- client rates;
- retransmissions;
- roaming;
- authentication;
- DHCP;
- AP PoE;
- port speed;
- switch uplink.
Strong signal does not mean capacity. An AP can have adequate RSSI and still suffer contention, interference, or a bottleneck in the wired path.
The Server or Application Can Also Be the Bottleneck
If the physical network, interfaces, switches, routes, and services are stable, the application must enter the analysis.
Storage, CPU, databases, queues, session limits, external dependencies, and application architecture can create slowness perceived as a “network problem.”
Good troubleshooting ends when the evidence locates the cause, even if it is outside the network.
WAN and External Providers
Internet access and intersite circuits must be analyzed separately from the LAN.
Compare latency and loss at different points along the path. Verify the local interface, CPE, circuit, routing, and provider performance. On redundant links, confirm whether failover occurred as expected and whether the secondary path has sufficient capacity.
Opening a provider ticket with time, source, destination, measurements, and evidence improves investigation quality compared with the generic description “slow Internet.”
Recent Changes Are a Valuable Source of Hypotheses
Incidents that appear shortly after a switch, firmware, VLAN, patching, firewall-policy, AP-expansion, or server-migration change should be correlated with that change.
This does not mean automatically blaming the change, but it becomes a priority hypothesis. Change management and configuration records reduce investigation time because they allow previous and current states to be compared.
What the Internal Team Can Safely Do
An IT team can perform initial checks without turning troubleshooting into uncontrolled intervention:
- confirm the scope of impact;
- record time and symptoms;
- test another known-good point;
- check port status;
- review logs and monitoring;
- validate IP, gateway, and DNS;
- confirm Wi-Fi association and parameters;
- correlate with changes;
- record evidence before making changes.
Actions that affect multiple users — core reboot, routing changes, firewall changes, disabling redundancy — require impact assessment, a maintenance window, and rollback planning.
When Is Specialized Diagnosis Necessary?
When an incident spans multiple layers, returns after local corrections, or the infrastructure lacks reliable documentation, the next step should not be to replace equipment: it should be to build evidence and prioritize risks.
Escalate when the incident is recurring, affects critical systems, crosses several disciplines, or cannot be isolated with operational tools.
Clear signs include:
- intermittent physical failures;
- suspected uncertified cabling;
- optical backbone with loss or unknown events;
- unstable PoE;
- lack of documentation;
- architecture with multiple single points of failure;
- problems that return after temporary corrections;
- need to measure and prove cause before investment.
In these cases, diagnosis may include surveys, Due Diligence, certification, measurements, log analysis, architecture review, and an upgrading plan.
Certification as a Diagnostic Tool
Suspected physical failure must be measured. Technical testing allows links, fibers, and performance conditions to be verified using documented criteria, turning a perception of instability into engineering evidence.
When the problem is associated with the physical medium, certifying selected links or the entire system can turn a hypothesis into evidence.
The plan should define the limit, test configuration, identification, instrument, calibration, FAIL handling, and file format. Mixing Permanent Link and Channel without recording what was tested undermines interpretation.
Symptom and Priority-Test Matrix
| Symptom | Initial evidence | Next action if it persists |
| one workstation drops | link, port, patch cord, IP | link certification / configuration analysis |
| several workstations on the same switch | uplink, CPU, power, STP | analyze switch and dependencies |
| AP reboots | PoE, logs, port, power | test channel, budget, and switch |
| voice with dropouts | loss, jitter, queues, Wi-Fi/WAN | locate the degraded segment |
| only names fail | DNS and server reachability | analyze queries and records |
| only Internet fails | gateway, firewall, WAN | compare LAN vs. external circuit |
| an entire VLAN fails | trunk, SVI/gateway, policy | review Layer 2/3 and changes |
| performance worsens at peak times | utilization and drops | capacity, QoS, and architecture |
This matrix does not replace engineering; it organizes the sequence of hypotheses.
Troubleshooting and MTTR
MTTR is influenced not only by the team’s technical capability but also by observability and documentation.
If no one knows which outlet corresponds to which port, which uplink serves a given rack, or which VLAN belongs to a system, every incident begins by reconstructing the network. This increases downtime.
Identification, topology, port maps, inventory, monitoring, and baseline reduce the time needed to locate the failure and allow specialists to move directly to relevant hypotheses.
Root Cause vs. Temporary Correction
A restarted port and restored service do not prove a permanent correction.
After restoring operation, ask:
- what evidence explains the failure?
- why did it occur now?
- is another point subject to the same mechanism?
- does the correction eliminate the cause or only the symptom?
- is an upgrading design required?
- does the documentation need to be updated?
- should any metric be monitored from now on?
This process turns incidents into engineering improvement.
Recurring Problems Indicate the Need for Upgrading
When the root cause lies in topology, capacity, segmentation, redundancy, or switching design, repeating troubleshooting does not eliminate the failure mechanism. The permanent correction becomes a network design project.
If the same symptoms return, there may be a structural limitation: degraded cabling, undersized uplink, unsuitable topology, insufficient PoE, lack of redundancy, VLANs accumulated without governance, or assets without adequate capacity.
In this scenario, troubleshooting should generate an action plan and, where necessary, an upgrading design. Continuing to make local corrections increases operating cost and preserves risk.
Post-Incident: Record What Was Learned
A root-cause record may contain:
- incident and impact;
- start, detection, and recovery;
- evidence collected;
- immediate cause;
- root cause;
- contributing factors;
- correction applied;
- preventive actions;
- owners and deadlines;
- documentation update;
- indicators that will be monitored going forward.
This history prevents repeated investigation and helps identify patterns.
Final Considerations
Network troubleshooting is a diagnostic engineering process. The greater the criticality, the less room there is for trial and error. The correct approach defines the failure domain, preserves evidence, tests hypotheses, measures the network by layers, and only then applies the correction.
The easiest network to troubleshoot is one that already has identification, documentation, a baseline, and monitoring. When recurring problems generate evidence, root-cause analysis, and an upgrading plan, the organization stops merely reacting to incidents and begins increasing reliability in a structured way.
Technical References
[1] IEEE. IEEE 802.3 — Ethernet. Available at: https://standards.ieee.org/ieee/802.3/7071/
[2] ISO/IEC. ISO/IEC 11801-1:2017 — Information technology — Generic cabling for customer premises — Part 1: General requirements. Available at: https://www.iso.org/standard/66182.html
[3] IEC. IEC 61935-1:2019 — Specification for the testing of balanced and coaxial information technology cabling. Available at: https://webstore.iec.ch/en/publication/31201
[4] IETF. RFC 2131 — Dynamic Host Configuration Protocol. Available at: https://datatracker.ietf.org/doc/html/rfc2131
[5] IETF. RFC 1034 — Domain Names — Concepts and Facilities. Available at: https://datatracker.ietf.org/doc/html/rfc1034
[6] ABNT. ABNT NBR 14565 — Structured cabling for commercial buildings and data centers. Catálogo ABNT. Available at: https://www.abntcatalogo.com.br/
Frequently Asked Questions
Define the symptom and narrow the failure domain: who is affected, which systems share the problem, when it started, and which elements are common to the affected devices.
No. Ping helps test reachability and ICMP latency, but by itself it does not prove application performance, cabling quality, DNS behavior, firewall policies, or uplink capacity.
No. Continuity mainly verifies the conductor map. Certification measures link parameters against the technical limits of the applicable category/class and test configuration.
When there is speed renegotiation, flaps, interface errors, localized intermittency, unstable PoE, a history of problematic terminations, or no certification evidence.
In production, this should not be the standard strategy. Prefer logs, sessions, counters, packet capture, and controlled test rules, with impact assessment and rollback.
When incidents are recurring, the cause lies in structural limitations involving capacity, architecture, PoE, cabling, redundancy, or documentation, and point corrections do not eliminate the failure mechanism.
Additional Technical Materials
Related Solutions
Related Services
- Engineering Technical Due Diligence
- Technical Testing
- Logical and Corporate Network Design
- Cisco Consulting for Network Diagnosis, Design, and Modernization
Main Content on the Topic
- Network Stability and Performance: Diagnosis, Causes, and Correction
- Physical Network vs. Logical Network