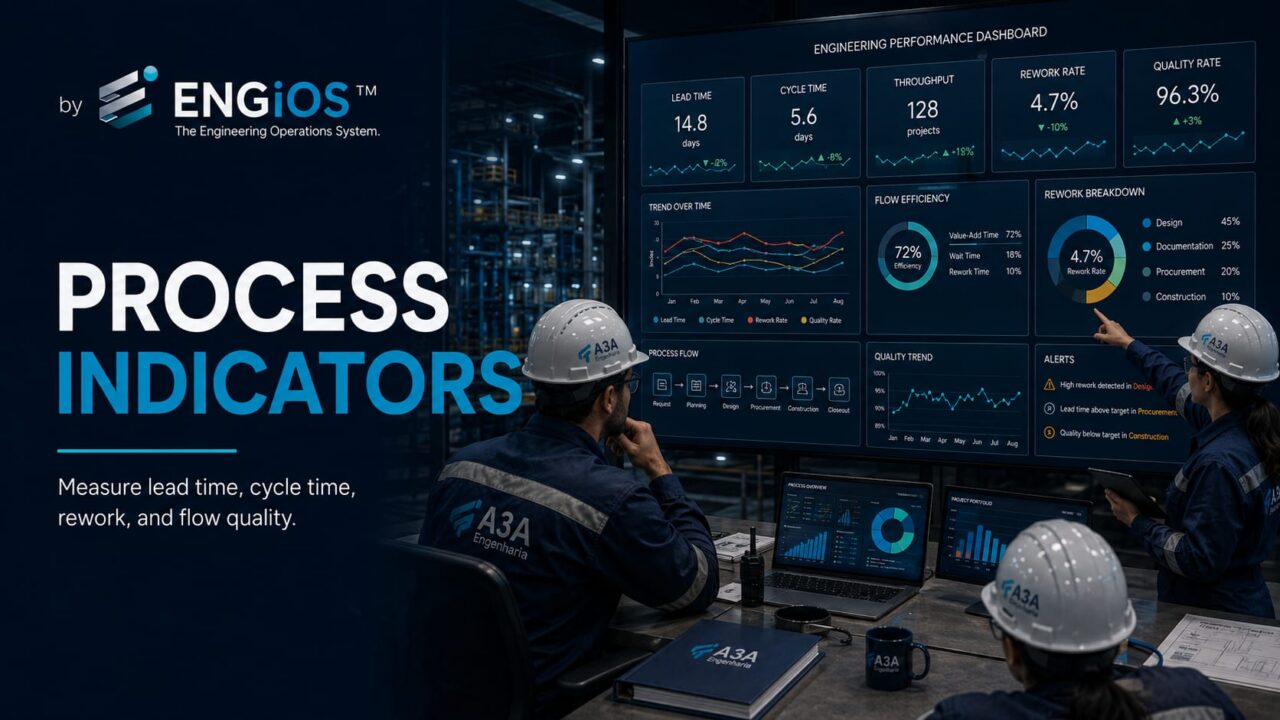
How to define Engineering process indicators using lead time, WIP, aging, throughput, rework, first pass yield, and SLA without confusing process and project metrics.
Check it out!
Engineering process indicators are measures used to demonstrate whether a recurring flow is producing the expected result with schedule, quality, capacity, cost, and risk compatible with its objectives. They are not used only to build dashboards. They answer concrete management questions: how long the process customer waits, where work ages, how much returns, what proportion is approved on the first pass, and whether capacity is keeping pace with demand.
In Engineering companies, processes such as document review, RFI handling, change management, procurement, inspection, NCRs, measurements, approvals, and commissioning may involve dozens of stages and participants. Measuring only individual productivity or the number of completed tasks creates a partial view. A process may produce a high volume and still maintain a large queue; meet volume targets while increasing rework; reduce local time while increasing end-to-end lead time.
For this reason, a good measurement system needs to combine indicators of results, flow, quality, capacity, and governance. The central question is not “how many KPIs can we track?” but which few measures make it possible to understand whether the process is working and why its performance is changing.
What are process indicators?
Process indicators are quantitative measures or, in some cases, structured classifications used to monitor process performance and results. The ISO 9001 process approach includes defining monitoring and measurement requirements, performance analysis, lead times, failures, waste, and other measures of conformity with objectives.
APQC recommends selecting metrics based on process purpose, boundaries, stakeholders, and objectives. Its guidance organizes performance measures into categories such as cost-effectiveness, productivity, process efficiency, and cycle time, avoiding the idea that there is a universal list of KPIs valid for every organization.
In Engineering, the indicator needs to be connected to what the process should produce. A technical review process may aim to issue reliable decisions within the schedule required by the project. A procurement process may seek technically appropriate contracting within the time required for implementation. An NCR process should eliminate or control the deviation and prevent recurrence when applicable.
A metric gains management value only when it helps make a decision or test a hypothesis about the process.
Metric, indicator, and KPI: what is the practical difference?
The terms are often used as synonyms, but a simple distinction helps organize management.
- metric: any observable process measure, such as the number of documents received;
- indicator: a measure interpreted in relation to a performance question, such as the percentage of documents approved on time;
- KPI: an indicator considered critical for demonstrating whether the process is meeting a relevant objective.
A process may have dozens of metrics available in systems and still need only a few KPIs. Too many indicators create noise and make accountability more difficult.
APQC recommends limiting and organizing measures, highlighting one strategically important KPI per process or objective, supported by a small set of explanatory indicators. This logic is particularly useful in Engineering: the process owner needs to see the result quickly and then investigate the causes.
For example, if the main KPI is lead time for the document approval process, supporting indicators may include waiting time by stage, rework rate, aging, percentage of rejected inputs, and decision time by authority level.
Before measuring, define the process boundary
Indicators can be technically correct and still drive wrong decisions when the measurement boundary does not represent the actual result.
If review lead time starts only when the reviewer opens the document and ends when comments are recorded, all time spent waiting for triage remains invisible. If procurement is measured only from RFQ issuance to proposal receipt, the period during which the requisition was stalled because of incomplete scope does not appear.
The boundary should be consistent with the end-to-end process. This means defining:
- start event;
- end result;
- customer or user of the result;
- entry conditions;
- exit criteria;
- relevant exceptions;
- units of analysis.
Without this definition, two areas may use the same indicator name while measuring different periods.
Which dimensions should a good indicator system balance?
Measuring only speed can increase risk. Measuring only quality can hide slowness. Measuring productivity alone can encourage volume at the expense of results.
A balanced structure can combine six dimensions.
| Dimension | Management question | Examples |
| Result | does the process deliver what it should? | acceptance, requirement compliance, resolution |
| Time and flow | how long does the customer wait and where? | lead time, waiting, aging |
| Quality | how much work is correct when it exits? | FPY, rework, rejection |
| Capacity | does the system keep pace with demand? | throughput, WIP, backlog |
| Cost and effort | how much resource is consumed? | HTE per item, cost per transaction |
| Risk and governance | do decisions and controls work? | exceptions, critical SLA, approval time |
The combination depends on the process. A low-criticality approval flow may emphasize time and quality. An inspection process may require greater weight for compliance, evidence, and risk. Procurement may combine schedule, technical quality of requisitions, competitiveness, and supplier performance.
A dashboard does not correct a poorly defined process. Before choosing KPIs, boundaries, result, owner, and the causes that actually explain schedule, quality, and capacity need to be defined.
Lead time: how long does the process customer wait?
Lead time is one of the most relevant measures because it represents the elapsed time from the defined start to the final result. In a knowledge process, it includes both execution periods and waiting periods.
Example: an RFI is opened on August 1 and receives an accepted formal response on August 8. If the boundary was defined this way, lead time is the total time between these events, regardless of how many hours were actually spent on analysis.
The indicator answers a simple question: how long does the process customer need to wait to obtain the result?
Lead time alone, however, does not explain the cause. To interpret deterioration, the flow needs to be decomposed into processing, waiting, blocking, rework, and decision time.
The Lean Enterprise Institute distinguishes lead time from the time required to perform an activity or process. This distinction helps show why a flow may involve only a few hours of work but last many days.
Processing time: how much time is actually consumed in execution?
Processing time is the time during which the item receives actual work. In technical processes, measuring it can be more difficult than measuring lead time because professionals alternate between demands.
Even a sample can be useful. If a technical opinion takes two hours of technical analysis but remains in the process for nine days, focusing exclusively on analyst productivity will have limited impact on total duration.
Comparing lead time and processing time helps identify the share of time lost in:
- queues;
- waiting for information;
- handoffs;
- approvals;
- external blockers;
- rework;
- competing priorities.
This analysis connects indicators to the article on Bottlenecks in Engineering Processes, where the central issue is locating the organizational constraint.
Cycle time: how to use it without confusing different objects
Cycle time can have specific definitions depending on the method and context. In flow management, it is often used to represent the time between the actual start of work on an item and its completion. The Lean Enterprise Institute defines cycle time as the time required to produce a part or complete a process, measured by actual execution.
On the A3A Engenharia website, the article Agile Metrics vs. EVM in Hybrid Projects already addresses cycle time as an operational flow metric associated with throughput, WIP, SPI, and CPI. This article does not seek to compete with that intent.
Here, cycle time appears as one possible measure within a system for recurring process performance. The object is not project performance as an undertaking, but the functioning of organizational processes that can be executed repeatedly by multiple projects.
The main caution is to document the definition being used. “Review cycle time” may mean the time from the start of analysis to its completion, while “review lead time” may include waiting from submission. Without an explicit rule, comparisons lose value.
Waiting time: how much of the duration is simply waiting?
Waiting time is the period during which the item is within the process boundary but receives no actual processing because it is waiting for a resource, information, decision, date, supplier, or readiness condition.
In Engineering, this measure is extremely useful because much of the duration may exist between activities.
Types of waiting include:
- review queue;
- approval queue;
- waiting for a supplier response;
- blocking due to field information;
- dependency on another discipline;
- waiting for a decision meeting;
- waiting for a preceding document;
- hold point not released.
The objective is not to eliminate all waiting. Some waiting is necessary because of sequence, safety, maturity, or contract. The analysis should distinguish necessary waiting from avoidable waiting.
Throughput: how much can the process complete per period?
Throughput measures the number of items completed in a unit of time. It may be documents per week, RFIs resolved per month, requisitions contracted per period, or NCRs closed with verified effectiveness.
It is a measure of output capacity, not individual effort.
The indicator should use comparable units. If some items are far more complex than others, counting them as equivalent may distort the analysis. Possible strategies include segmenting by criticality class, document type, discipline, or complexity range.
Throughput gains value when compared with arrival rate. If 120 items enter per week and only 90 are sustainably completed, WIP tends to grow. This difference helps identify structural pressure on the process.
WIP: how much work has started but is not yet finished?
WIP — Work in Progress — represents work underway. In Engineering, it may include documents under review, open RFIs, requisitions being contracted, unclosed NCRs, open risk actions, technical pending items, and incomplete commissioning packages.
High WIP is not automatically bad. It may exist because of process size, dependencies, or demand characteristics. The problem arises when it grows without control or without relation to completion capacity.
Kanban in Engineering Projects examines WIP limits and policies in greater depth. In this article, WIP is treated as a process indicator for explaining flow and capacity.
A useful view combines:
- total WIP;
- WIP by stage;
- WIP by age;
- blocked WIP;
- WIP by criticality;
- WIP without a defined owner.
Aging: how long has each item been open?
Aging measures the age of items that have not yet been completed. It differs from lead time because it looks at work in progress, not only closed items.
This indicator avoids a classic problem: analyzing only completed cases while ignoring the stock of older items that remains in the process.
A portfolio can be divided into ranges according to SLA or historical behavior. For example:
- up to 2 days;
- 3 to 5 days;
- 6 to 10 days;
- 11 to 20 days;
- more than 20 days.
The ranges are only examples and should be defined for each process.
Aging is especially useful for RFIs, NCRs, punch lists, approvals, vendor documents, risk actions, and change requests.
First Pass Yield: how much is correct on the first pass?
First Pass Yield — FPY — represents the proportion of items that pass through a stage or process without requiring correction or rework before acceptance.
In Engineering processes, the adaptation needs to be careful. Not every additional review means failure; designs may require legitimate iteration. The indicator should be applied where clear completeness and input or output quality criteria exist.
Possible examples:
- percentage of requisitions accepted by Procurement without return because of missing data;
- percentage of vendor documents approved without blocking comments;
- percentage of commissioning packages accepted without document-related pending items;
- percentage of measurements accepted without administrative correction;
- percentage of documents that pass internal verification without significant rework.
The value of FPY is to make the hidden cost of re-entry visible. A team may have high gross throughput and low net output if many items return.
Rework rate: how much effort is being repeated?
Rework rate complements FPY by measuring items or effort that need to return to previous stages.
It can be expressed as the number of returned items, additional cycles, HTE consumed in corrections, or percentage of deliverables reprocessed. The choice depends on data availability and process type.
It is important to classify the cause. Mixing error, scope change, and technical iteration into a single indicator can lead to unfair or incorrect actions.
A simple taxonomy can separate:
- technical error;
- incomplete input;
- changed requirement;
- interface failure;
- unaddressed comment;
- inadequate documentation;
- legitimate change;
- reopened decision;
- nonconforming supplier.
The objective is to learn where the process loses capacity, not to create a blame ranking.
Input rejection rate
One of the most useful metrics for identifying upstream problems is the percentage of received items that do not meet the minimum criteria to begin processing.
Examples:
- requisition without the necessary technical description or specification;
- RFI without document reference;
- document without a valid revision;
- inspection requested without readiness documentation;
- measurement without required evidence;
- commissioning package without complete checklists.
High input rejection reduces the capacity of the next stage and creates ping-pong between areas. The indicator should be monitored together with the cause and the party responsible for correcting the process.
SLA and schedule compliance: percentage within the commitment
SLA represents a service-level commitment. In internal processes, it may define the expected time for analysis, response, or approval. In contracts, it may be associated with a formal obligation.
Common indicators include:
- percentage completed within the SLA;
- percentage overdue;
- average delay of overdue items;
- aging of overdue items;
- SLA by criticality.
Using a single deadline for all items may be inappropriate. A simple review and the analysis of a critical technical deviation do not necessarily involve the same effort or risk. SLA can be segmented by type, priority, and complexity.
The indicator also needs to account for legitimate suspension when the clock depends on third-party information. If the clock stops, the rule should be explicit and auditable.
Decision time and governance bottlenecks
Processes may have adequate technical capacity and remain slow because decisions are waiting for authority.
Measuring decision time helps identify:
- centralized approval;
- unavailable sponsor;
- committee with inappropriate frequency;
- vague escalation criteria;
- exceptions without an owner;
- decisions repeatedly reopened.
Engineering Process Governance defines how ownership and decision rights should be structured. The indicator makes it possible to verify whether this governance works in practice.
Exception rate: how much work falls outside the standard process?
Exceptions are necessary in Engineering processes, but a high frequency may indicate that the standard process does not represent reality.
An exception rate can measure items that:
- follow extraordinary approval;
- use a manual flow outside the workflow;
- require a waiver or deviation;
- bypass the normal order because of urgency;
- return because of an unforeseen condition;
- depend on an ad hoc decision.
The analysis needs to distinguish legitimate exceptions from shortcuts created because the formal process is impractical.
If 40% of cases require exceptional handling, the problem may lie in the process design, not in the users.
Result quality indicators
Not every process ends at “completed.” It is necessary to know whether the result meets the requirement.
Indicators may include:
- acceptance rate;
- nonconformities associated with the output;
- errors detected at a later stage;
- internal customer complaints;
- reopening of a closed item;
- failures attributed to delivered information;
- compliance with technical criteria.
These indicators prevent schedule optimization from sacrificing quality.
Cost and effort indicators
When the organization has reliable effort data, it can measure cost or HTE per item, process, or delivery class.
Examples:
- average HTE per technical review;
- processing cost per requisition;
- hours consumed in rework;
- management effort per document;
- cost of poor quality associated with the process.
Interpretation should consider complexity. A reduction in HTE may reflect efficiency or merely less depth of analysis. For this reason, cost should be read together with quality and results.
The average can hide the problem: use distributions and percentiles
The average is intuitive, but processes with high variability can be poorly represented by a single value.
Imagine ten requests with lead times of 2, 2, 3, 3, 4, 4, 5, 6, 8, and 40 days. The average is pulled by the extreme case, while most items behave differently. On the other hand, excluding the 40-day case would hide an important risk.
In addition to the average, useful measures may include:
- median;
- percentiles such as P80 or P90;
- minimum and maximum;
- deviation or range of variation;
- distribution by class;
- aging of items still open.
The objective is not to make statistics unnecessarily sophisticated. It is to prevent a single number from hiding stability, tails, and exceptions.
NIST emphasizes that process control depends on understanding variation and distinguishing stable behavior from relevant changes. In administrative Engineering processes, statistical rigor should be proportional to data volume and quality, but the principle remains useful.
Trend indicators vs. result indicators
A useful classification separates measures that show results after they occur from measures that help anticipate deterioration.
Result indicators
- completed lead time;
- percentage within SLA;
- acceptance rate;
- rework performed;
- cost per item.
Leading indicators
- growing WIP;
- increasing aging;
- queue at a critical resource;
- input rejection rate;
- increasing exceptions;
- blocked backlog;
- demand above sustainable throughput.
A process owner who monitors only completed results may react too late. Trend indicators help intervene before the SLA is missed.
Local indicators vs. end-to-end indicators
Each area needs operational measures, but the process should have a cross-functional result.
Example: Engineering measures preparation time; Quality measures verification time; Document Control measures issuance time. All of them may meet their targets and total lead time may still be poor because of waiting between stages.
The solution is to create a hierarchy:
- end-to-end KPI linked to the result;
- stage indicators that explain this KPI;
- diagnostic metrics used when there is a deviation.
This reduces the risk of local optimization.
How to build an indicator tree
An indicator tree connects the result to possible causes.
If lead time worsens, the tree guides the investigation. The manager checks whether the cause lies in processing, queues, decisions, rework, or dependencies.
This structure is more useful than a dashboard with dozens of numbers that have no causal relationship.
A useful indicator must reveal where the flow is degrading—not merely record that the result got worse. When lead time, aging, WIP, and rework are analyzed together, it becomes easier to distinguish bottlenecks, waiting, quality loss, and governance problems.
See how to diagnose bottlenecks in Engineering processes
Example: document approval indicators
A document review and approval process may use lead time from submission to approved issue as its main KPI.
Supporting indicators:
| Indicator | Interpretation |
| total lead time | process customer experience |
| waiting for review | technical queue |
| decision time | authority and governance |
| FPY | quality of the first submission |
| return rate | re-entry and rework |
| WIP | amount of work in progress |
| aging | risk of forgotten items |
| % within SLA | reliability of the commitment |
The team may also segment by discipline, criticality, document type, or project.
The key precaution is not to use the indicator to compare engineers without controlling for complexity. The objective is to improve the system.
Example: Engineering Procurement indicators
Procurement can measure more than quotation turnaround time.
A possible set includes:
- lead time from requisition to award;
- Engineering-to-RFQ time;
- percentage of requisitions rejected for missing information;
- average number of clarification cycles;
- technical bid evaluation time;
- percentage of technically comparable proposals in the first round;
- vendor response time;
- scope changes after RFQ;
- PO or contract issuance time;
- on-time supplier deliveries.
These measures help distinguish a Procurement bottleneck from an Engineering maturity issue or supplier performance problem.
The article on Procurement in Engineering Projects explores the contracting journey in greater depth.
Example: indicators for NCRs and corrective actions
A nonconformity process may measure:
- time to containment;
- time to disposition;
- total NCR lead time;
- percentage overdue;
- aging by criticality;
- recurrence;
- percentage with identified cause;
- time to effectiveness verification;
- reopening rate.
The target must not encourage rapid administrative closure without a technical solution. A good KPI must preserve the quality of the result.
How to set targets without inventing arbitrary numbers
Targets should reflect requirements, risk, capacity, and customer expectations. Copying an external benchmark without considering context can produce impossible or irrelevant objectives.
A reasonable sequence is:
- stabilize the indicator definition;
- build a reliable baseline;
- analyze distribution and causes;
- identify contractual requirements or customer needs;
- estimate capacity and risk;
- define the target and improvement horizon;
- review after relevant process changes.
External benchmarking can support the analysis, but it does not replace internal understanding. APQC uses frameworks and comparative data precisely to contextualize performance, not to impose a universal target.
Data quality comes before the dashboard
A sophisticated indicator based on inconsistent data creates false confidence.
Before automating measurement, verify that:
- start and end events are recorded consistently;
- timestamps are not changed manually without control;
- statuses have common definitions;
- cancelled items are handled explicitly;
- blocks can be identified;
- return causes use a useful taxonomy;
- duplicates are controlled;
- SLA suspension periods are traceable;
- users understand why the data are collected.
The measurement process also requires governance.
Avoid indicators that encourage the wrong behavior
Every metric influences behavior. If a team is measured only by the number of documents reviewed, it may prioritize simple items and let complex ones age. If the objective is to close NCRs quickly, cases may be closed before effectiveness is verified.
Signs of a poorly designed metric include:
- the indicator improves without perceived improvement by the customer;
- the problem is shifted to another stage;
- rework increases;
- easy cases are selected artificially;
- statuses are manipulated;
- items are closed and reopened to “reset” aging;
- exceptions increase outside the official flow.
For this reason, indicators must be balanced and reviewed by the process owner.
The process owner’s role in measurement
The process owner must ensure that indicators represent the complete process and are used for improvement, not merely for reporting.
Responsibilities include:
- approving definitions;
- ensuring boundary consistency;
- analyzing trends;
- initiating investigations of deviations;
- prioritizing improvements;
- adjusting targets when context changes;
- avoiding conflicting local metrics;
- ensuring decisions are recorded.
Engineering Process Governance provides the accountability structure required so that the dashboard is more than informative.
How to structure an analysis routine
An indicator without a decision routine tends to become a report.
A routine may include:
- reviewing the main KPI;
- comparing against baseline and target;
- analyzing trends;
- identifying relevant deviations;
- drilling down into explanatory indicators;
- analyzing aging and exceptions;
- defining actions;
- assigning an owner and due date;
- verifying the effect of the action.
The frequency should match the speed of the process. A daily flow may require weekly or even daily monitoring. A monthly process may be analyzed at another cadence.
A process dashboard is not a project dashboard
This distinction avoids conceptual overlap and management errors.
Project indicators answer questions about a temporary effort: progress, cost, schedule, risk, milestones, and earned value. Process indicators measure a recurring flow that can be executed by many projects.
For example:
| Question | Object | Appropriate indicator |
| is the project ahead of or behind plan? | project | SPI, milestones, schedule variance |
| how long does an RFI take to be resolved? | process | RFI lead time |
| how many documents are aging? | process | WIP and aging |
| is the cost of work performed aligned? | project | CPI / CV |
| how much rework exists in technical review? | process | FPY / return rate |
The article on Agile Metrics vs. EVM in Hybrid Projects remains the primary content for comparing flow metrics and project control. Here the focus is the measurement system for organizational processes.
How indicators support bottleneck diagnosis
Indicators do more than report performance; they help test causes.
If lead time increases while processing time remains stable, investigate waiting. If WIP grows while throughput remains constant, compare demand and capacity. If FPY falls, check input quality and rework. If decision time increases, investigate authority levels and governance.
This causal reading turns data into management.
Engineering Process Diagnosis and Optimization combines AS-IS mapping, bottleneck analysis, indicators, and TO-BE design so the organization can measure the effect of changes.
When should indicator collection be automated?
Automation makes sense when definitions are stable and events are recorded consistently. Before that, the dashboard may simply automate ambiguity.
Collection can evolve in stages:
- manual sampling to validate the concept;
- a controlled spreadsheet to build a baseline;
- extraction of existing data;
- system integration;
- an automated dashboard;
- alerts for aging, SLA, and exceptions.
The Process Management, Workflows, and Technical Approvals solution can structure events, owners, deadlines, and audit trails. The process and its metrics, however, must be defined before the platform.
Indicators for low-volume processes
Not every process has hundreds of occurrences. In Engineering, critical processes may have few cases and high consequences.
With low volume, complex statistical analyses may not be useful. The organization can combine:
- case-by-case monitoring;
- aging;
- milestone compliance;
- quality of the result;
- exception causes;
- structured qualitative analysis;
- cumulative trends over longer periods.
Rigor should be proportional to the available data and the risk of the decision.
Indicators for high-volume processes
Processes with a large number of occurrences allow greater use of distribution analysis, segmentation, and statistical control.
Possible analyses include:
- median and percentiles of lead time;
- stability by period;
- defect rate;
- volume by category;
- throughput trends;
- relationship between WIP and elapsed time;
- most frequent return causes;
- variation between units.
Process control methods, such as those described by NIST to monitor behavior and detect changes, may be applied when the data, repeatability, and context justify them.
How to start without creating a BI project
The organization does not need to wait for a data lake or a complete platform to start measuring processes.
A pilot can follow six steps:
- choose a process with a clear pain point;
- define its boundary and main KPI;
- select 3 to 6 explanatory indicators;
- collect a reliable historical sample;
- build the baseline;
- use the data in a real decision-making routine.
After value is demonstrated, collection can be automated.
The mistake is to start with the dashboard and then look for a question the charts can answer.
Common mistakes in process indicator management
Measuring everything the system provides
Data availability does not mean management relevance.
Using averages only
The average can hide tails, exceptions, and old items.
Comparing people without controlling for complexity
This encourages defensive behavior and distorts the system-level objective.
Mixing project and process
SPI, CPI, and physical progress do not replace lead time, aging, and quality in a recurring flow.
Defining SLA without capacity or risk
Arbitrary targets create chronic noncompliance or priority manipulation.
Measuring closure rather than outcome
Closing a status does not mean solving the problem.
Creating an indicator without an owner
Without someone responsible for interpreting and acting, the KPI becomes a report.
Automating an unstable definition
The dashboard starts reproducing inconsistencies at scale.
When should you engage a process indicators and performance assessment?
External analysis is useful when the organization has a great deal of data but little clarity about which metrics actually explain performance; when departments use different definitions; or when dashboards are green while delays and rework continue.
An assessment may include:
- definition of process boundaries;
- inventory of existing metrics;
- data quality analysis;
- selection of the main KPI;
- indicator tree;
- baseline for lead time, WIP, aging, and quality;
- segmentation by criticality;
- SLA review;
- definition of the analysis routine;
- integration with owners and governance;
- automation and dashboard roadmap.
The purpose is to transform data into a management and decision-making mechanism, not to increase the number of reports.
If the numbers exist but do not help explain delays, rework, or capacity, the problem is no longer a dashboard problem. The process, its boundaries, indicators, and responsibilities must be reviewed as a single system.
Learn about Engineering Process Diagnosis and Optimization
Final considerations
Engineering process indicators should reveal whether the flow is producing the expected result and explain why its performance changes. A balanced system combines outcome, lead time, waiting, WIP, throughput, aging, quality, rework, and governance according to the context.
No metric should be interpreted in isolation. Throughput may increase while rework worsens; lead time may fall because complex items remain in the queue; SLA may look good while exceptions are handled outside the system.
Mature measurement connects an end-to-end KPI to explanatory indicators, keeps definitions stable, analyzes distributions, and drives decisions. When this happens, the dashboard stops being a reporting layer and starts supporting diagnosis, prioritization, and continuous improvement of Engineering processes.
Technical references
[1] INTERNATIONAL ORGANIZATION FOR STANDARDIZATION (ISO). The process approach in ISO 9001:2015. Geneva: ISO, 2015. Available at: https://www.iso.org/files/live/sites/isoorg/files/archive/pdf/en/iso9001_2015_process_approach.pdf
[2] APQC. What Are the Best Metrics to Measure Process Performance? Houston: APQC. Available at: https://www.apqc.org/What-Are-the-Best-Metrics-to-Measure-Process-Performance
[3] LEAN ENTERPRISE INSTITUTE. Cycle Time. Lean Lexicon. Available at: https://www.lean.org/lexicon-terms/cycle-time/
[4] NATIONAL INSTITUTE OF STANDARDS AND TECHNOLOGY (NIST). What are Process Control Techniques? NIST/SEMATECH e-Handbook of Statistical Methods. Available at: https://www.itl.nist.gov/div898/handbook/pmc/section1/pmc12.htm
Frequently asked questions
It depends on the process objective, but a common set includes lead time, waiting time, WIP, aging, throughput, rework rate, first pass yield, SLA compliance, and quality of the result.
The definition must be documented for the context in use. In general, lead time represents total elapsed time from the defined start to the outcome, including waiting; cycle time usually represents the execution period of an item or process from the effective start of work.
It is the proportion of items that pass through a stage or process without requiring correction or rework before acceptance. It should be used only when clear completeness and quality criteria exist.
Lead time is normally calculated for completed items. Aging shows the age of work that is still open and reveals items that may be forgotten or stuck in queues.
No. Process indicators measure recurring flows such as approvals, RFIs, or procurement. EVM and project indicators measure the performance of a temporary effort against schedule, cost, and value produced.
There is no universal number, but management should remain lean. An effective practice is to have one main KPI tied to the process objective and a small number of supporting indicators that explain its variations.
Complementary technical materials
Main content on the topic
- Process Management and BPM: What It Is, Stages, and Application in Engineering
- End-to-End Processes in Engineering
- Bottlenecks in Engineering Processes
- Engineering Process Governance
Related technical content
- Agile Metrics vs. EVM in Hybrid Projects
- Kanban in Engineering Projects
- Procurement in Engineering Projects